Upon successful login, click Statistics from the left navigation bar. Doing so takes you to the Statistics screen.
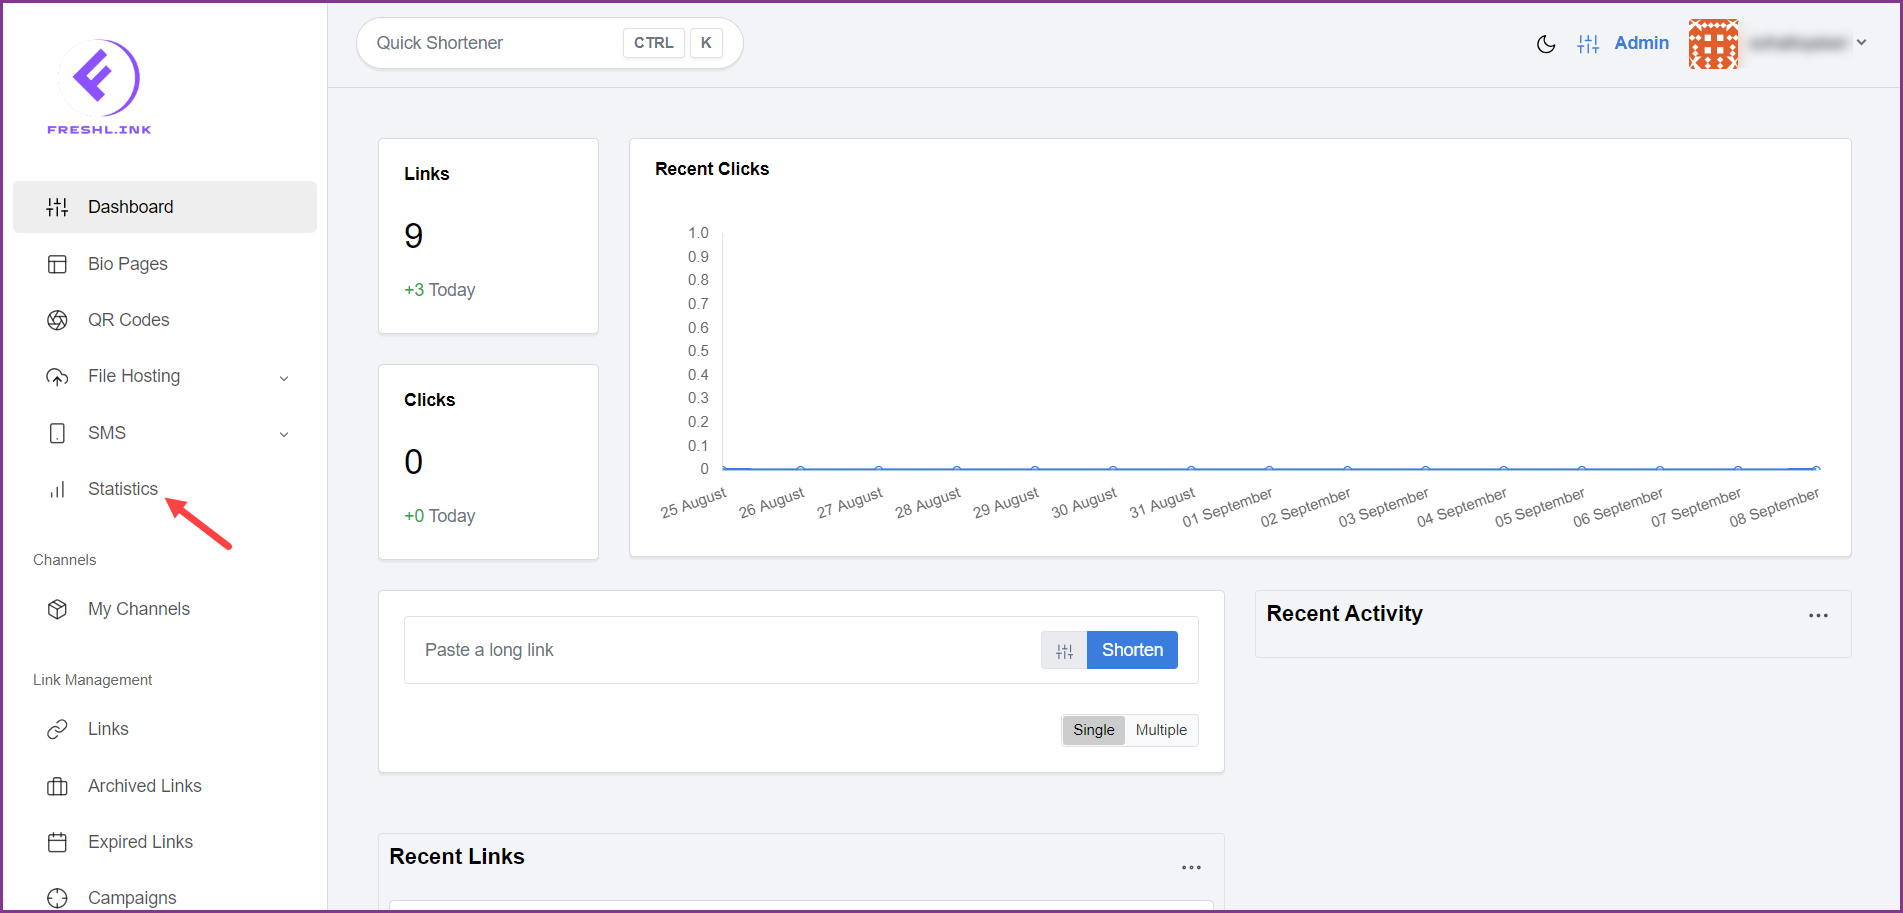
Here, a number of graphs and maps display the statistics for the created links.
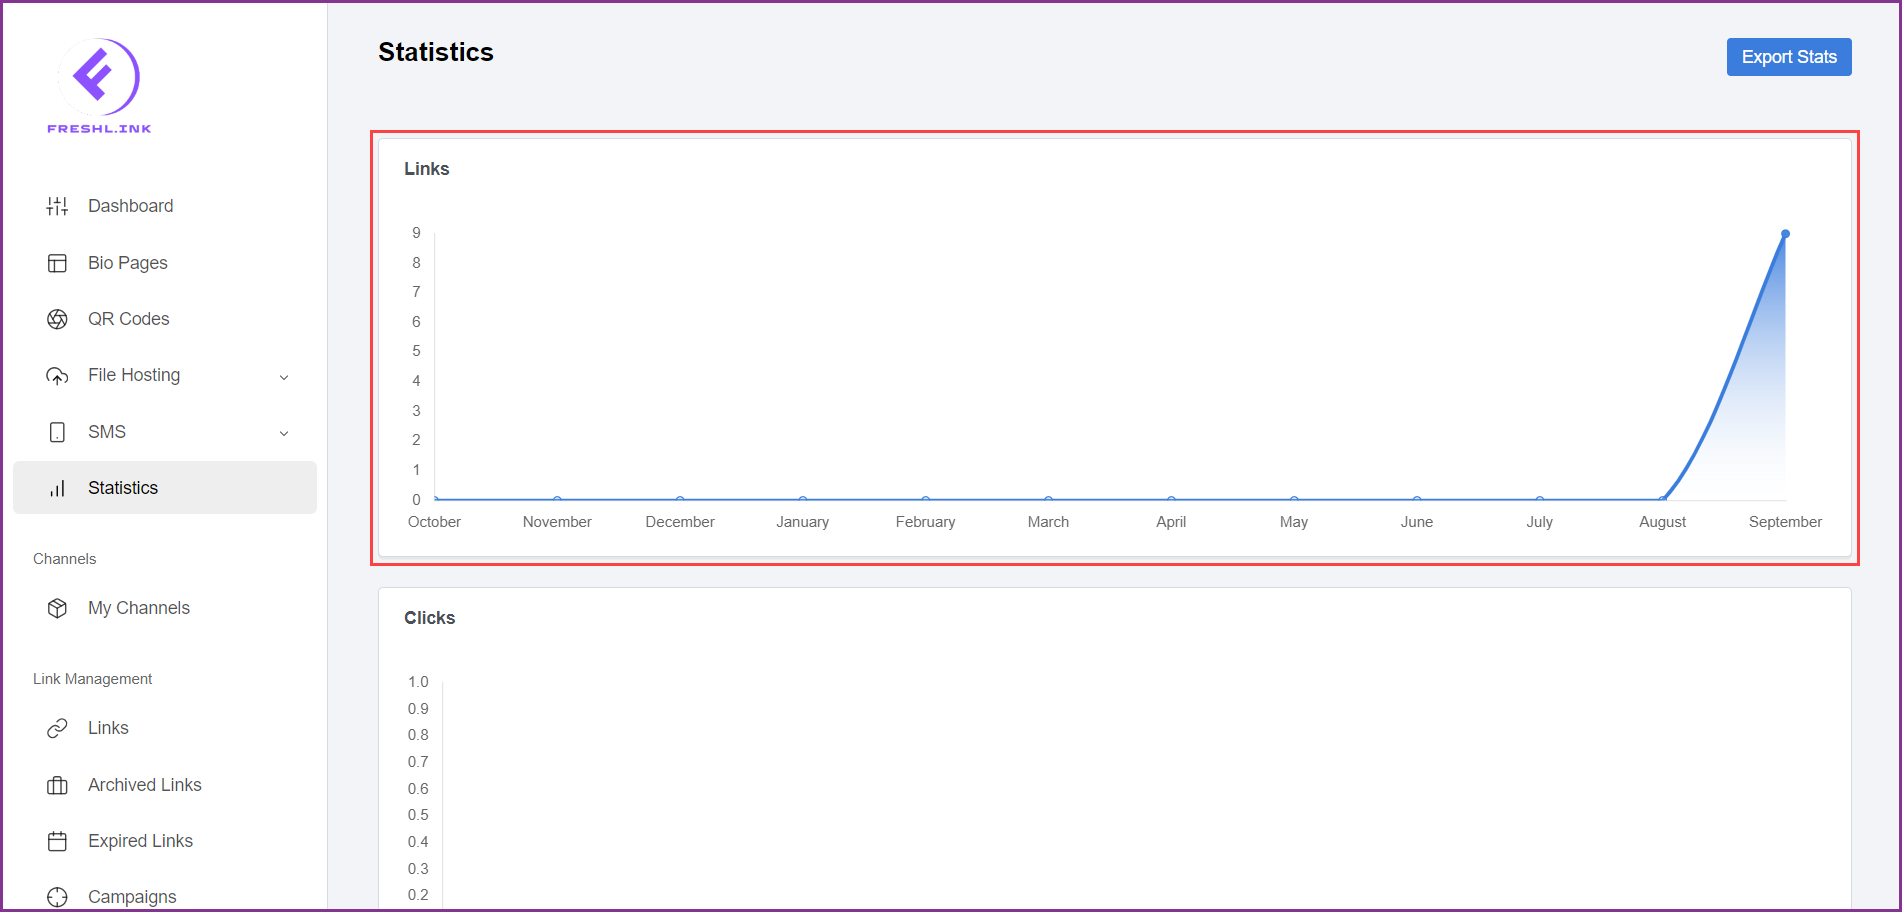
The Links graph maps the days (x-axis) against the number of links (y-axis) so that you can assess the trend of the links created.
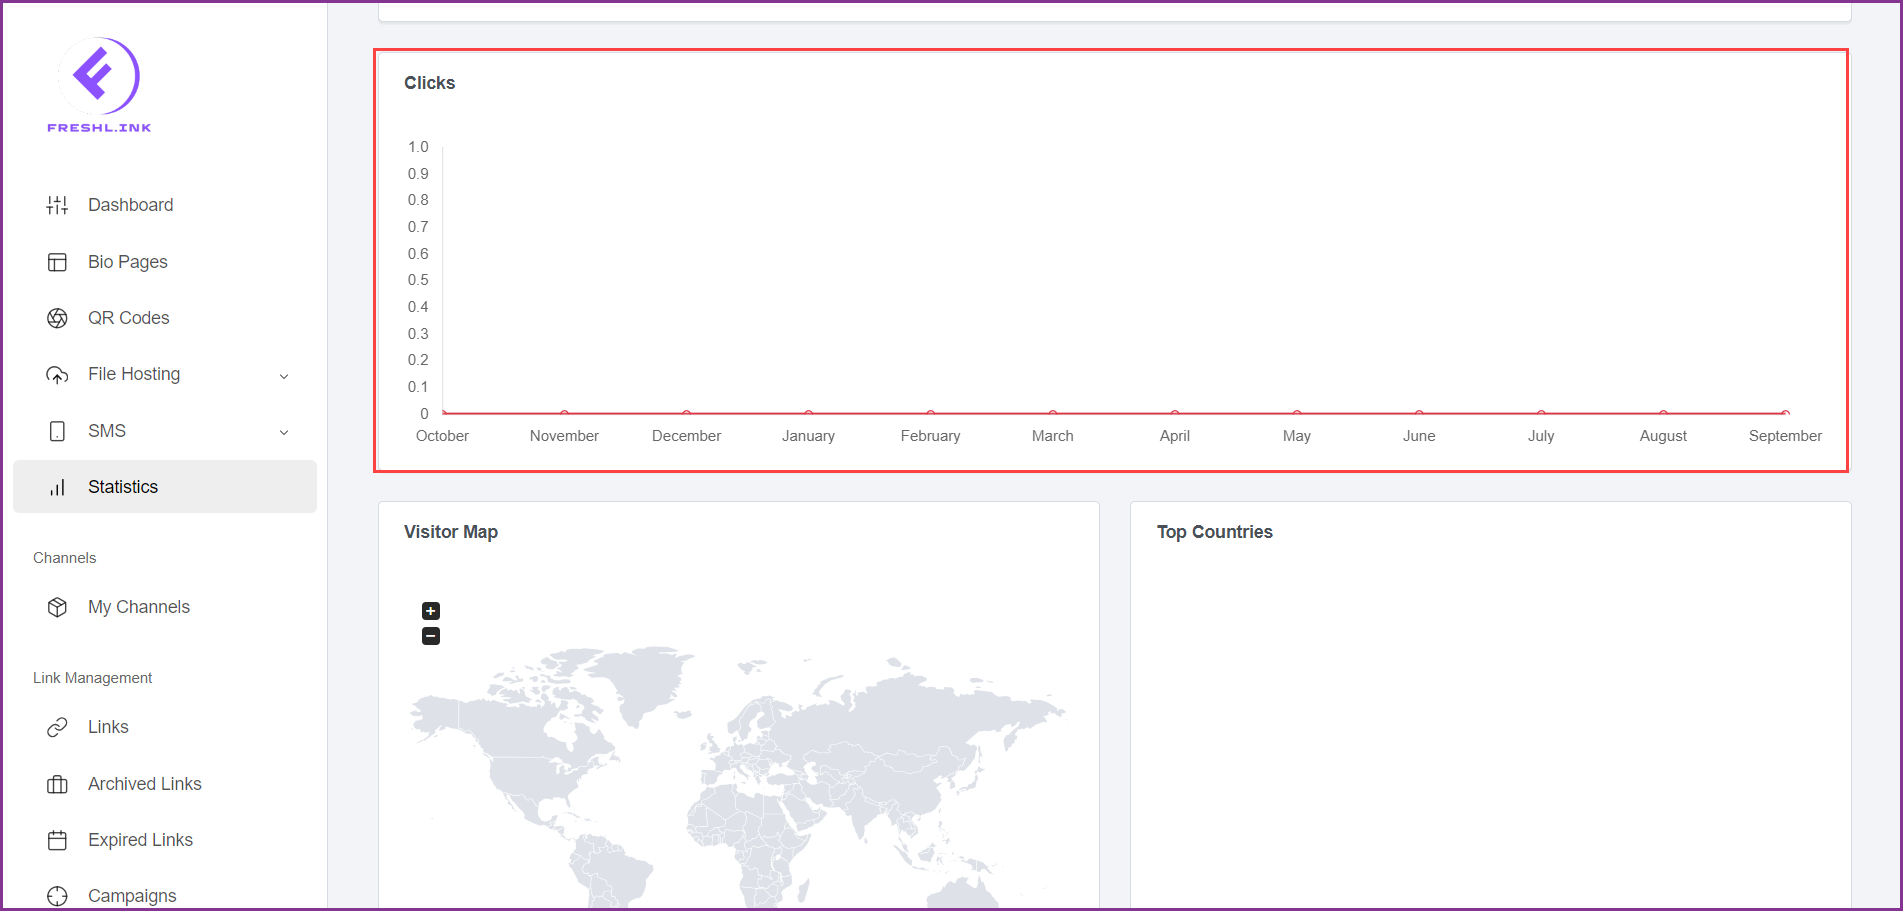
Similarly, the Clicks graph maps the days (x-axis) against the number of clicks (y-axis) to assess the trends in the clicks on your links.
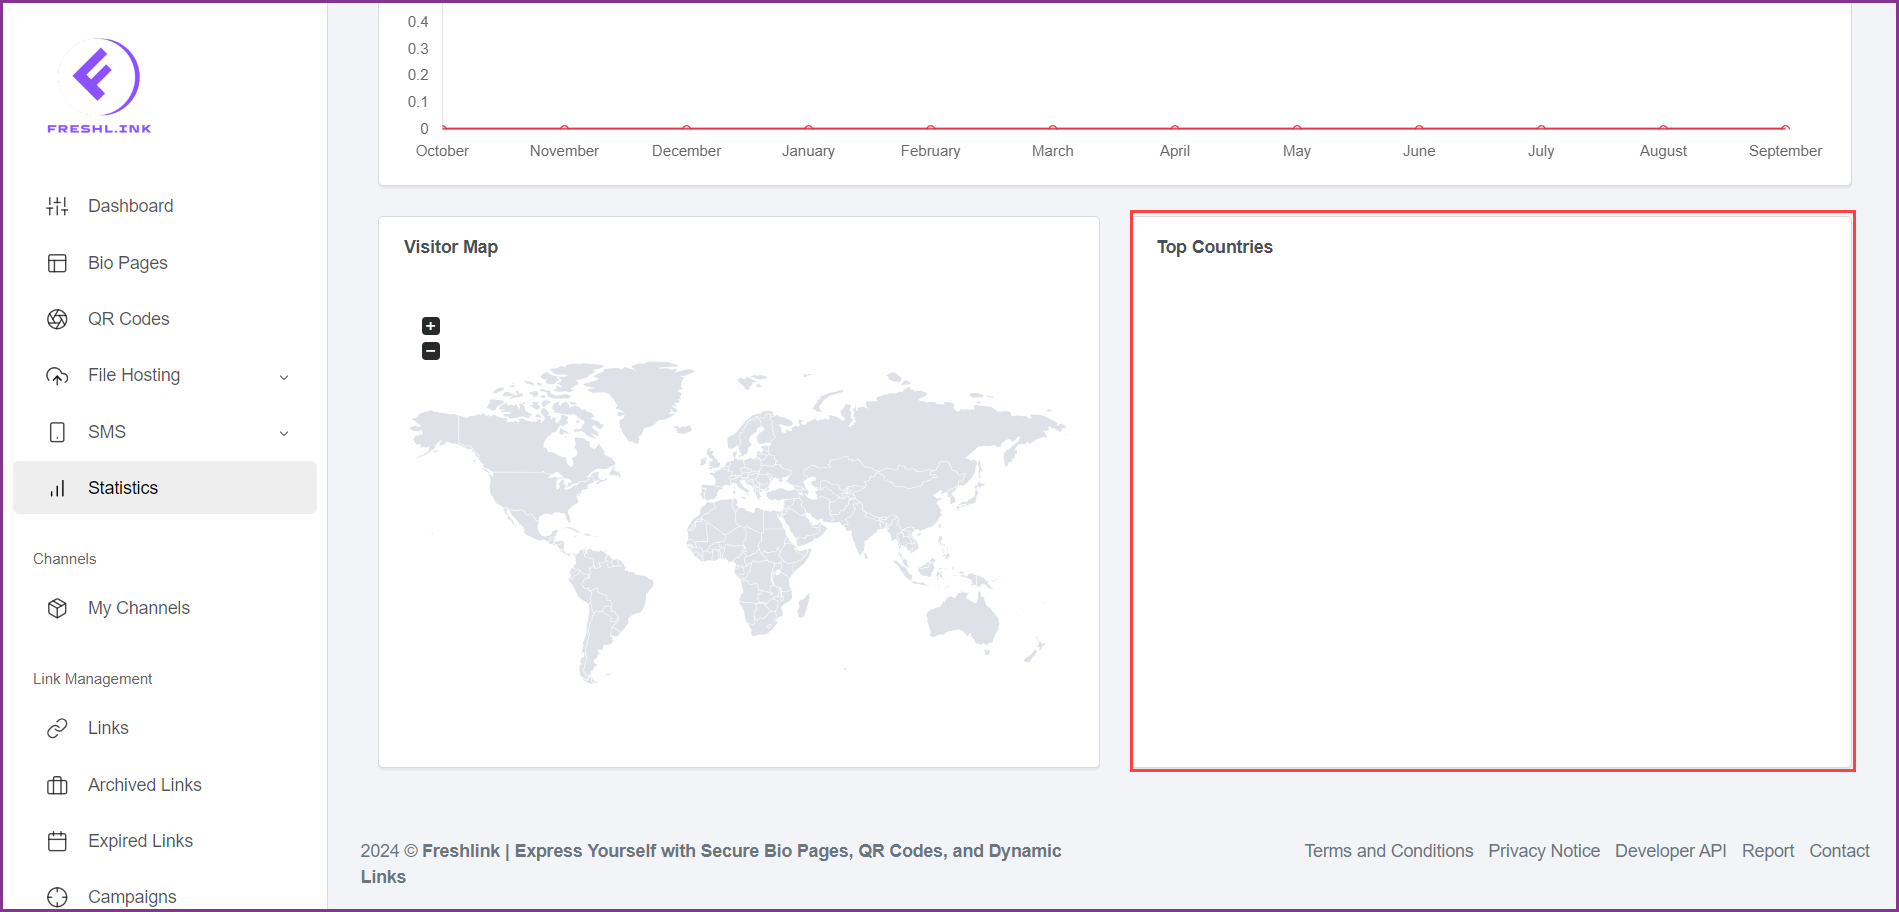
Moving further, the Visitor Map displays a world map for you to choose region in which you want to view the stats.
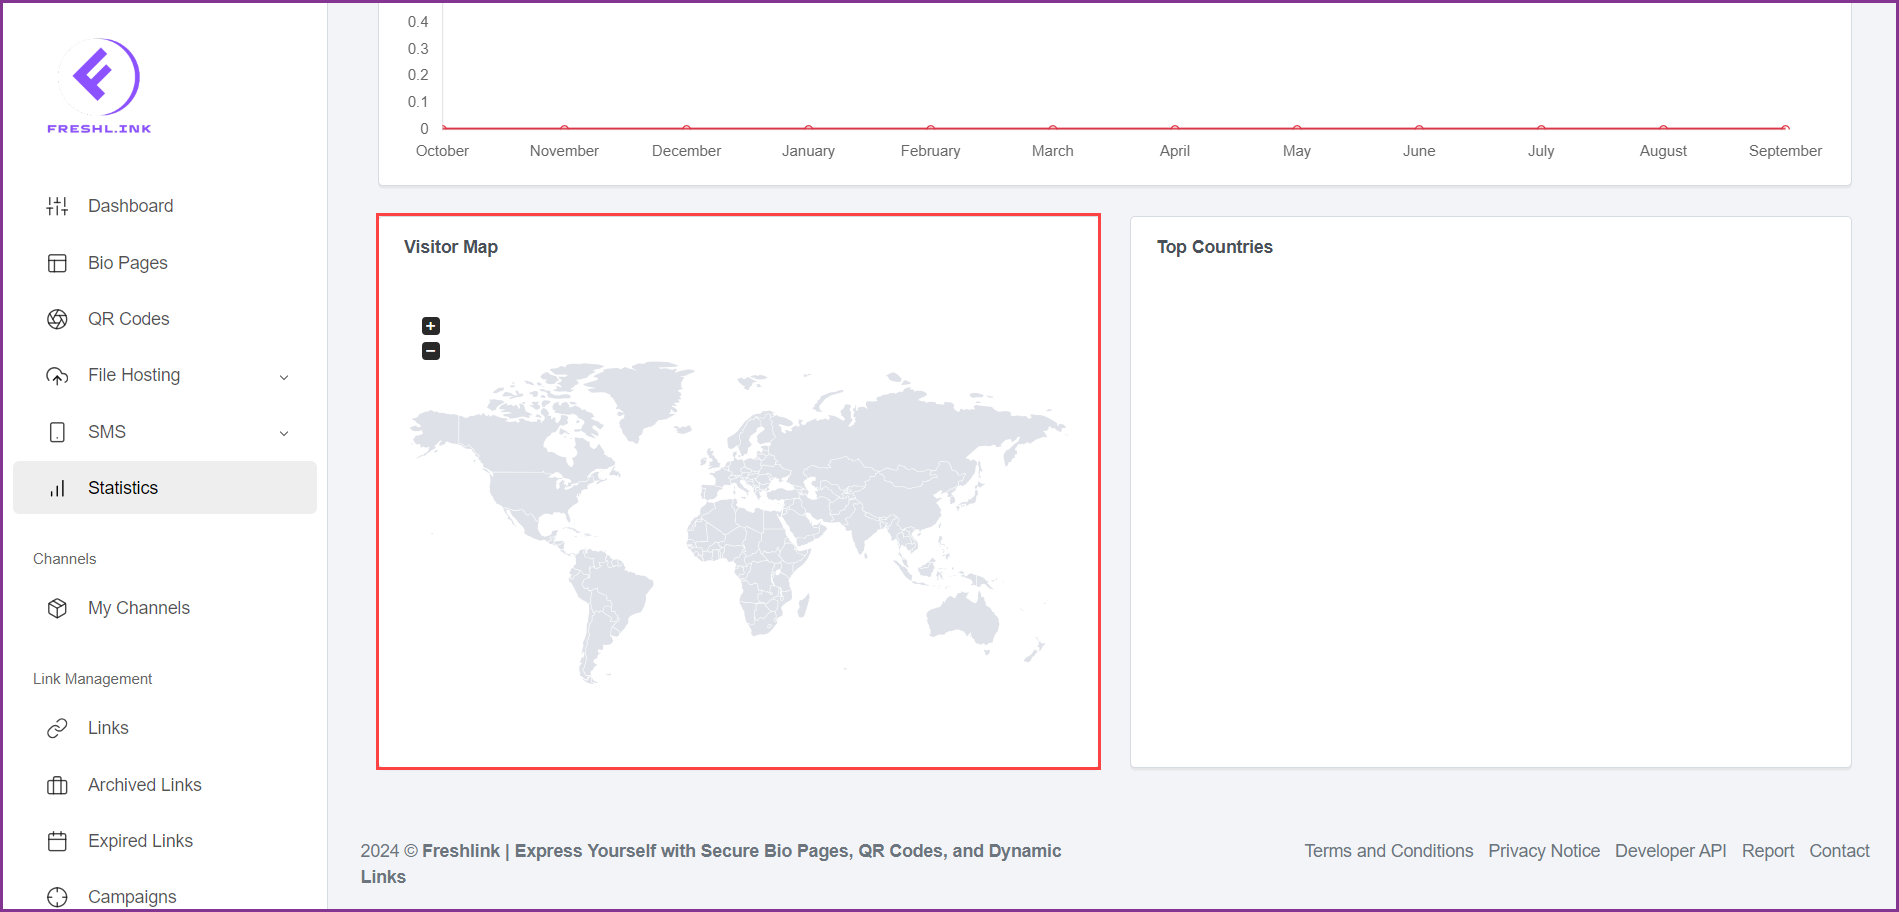
At the end is the Top Countries section that lists the top countries from where the clicks have been made on your links.