Freshlink > Left Navigation Bar > Dashboard
Follow the above-mentioned workflow to land on the Dashboard screen.
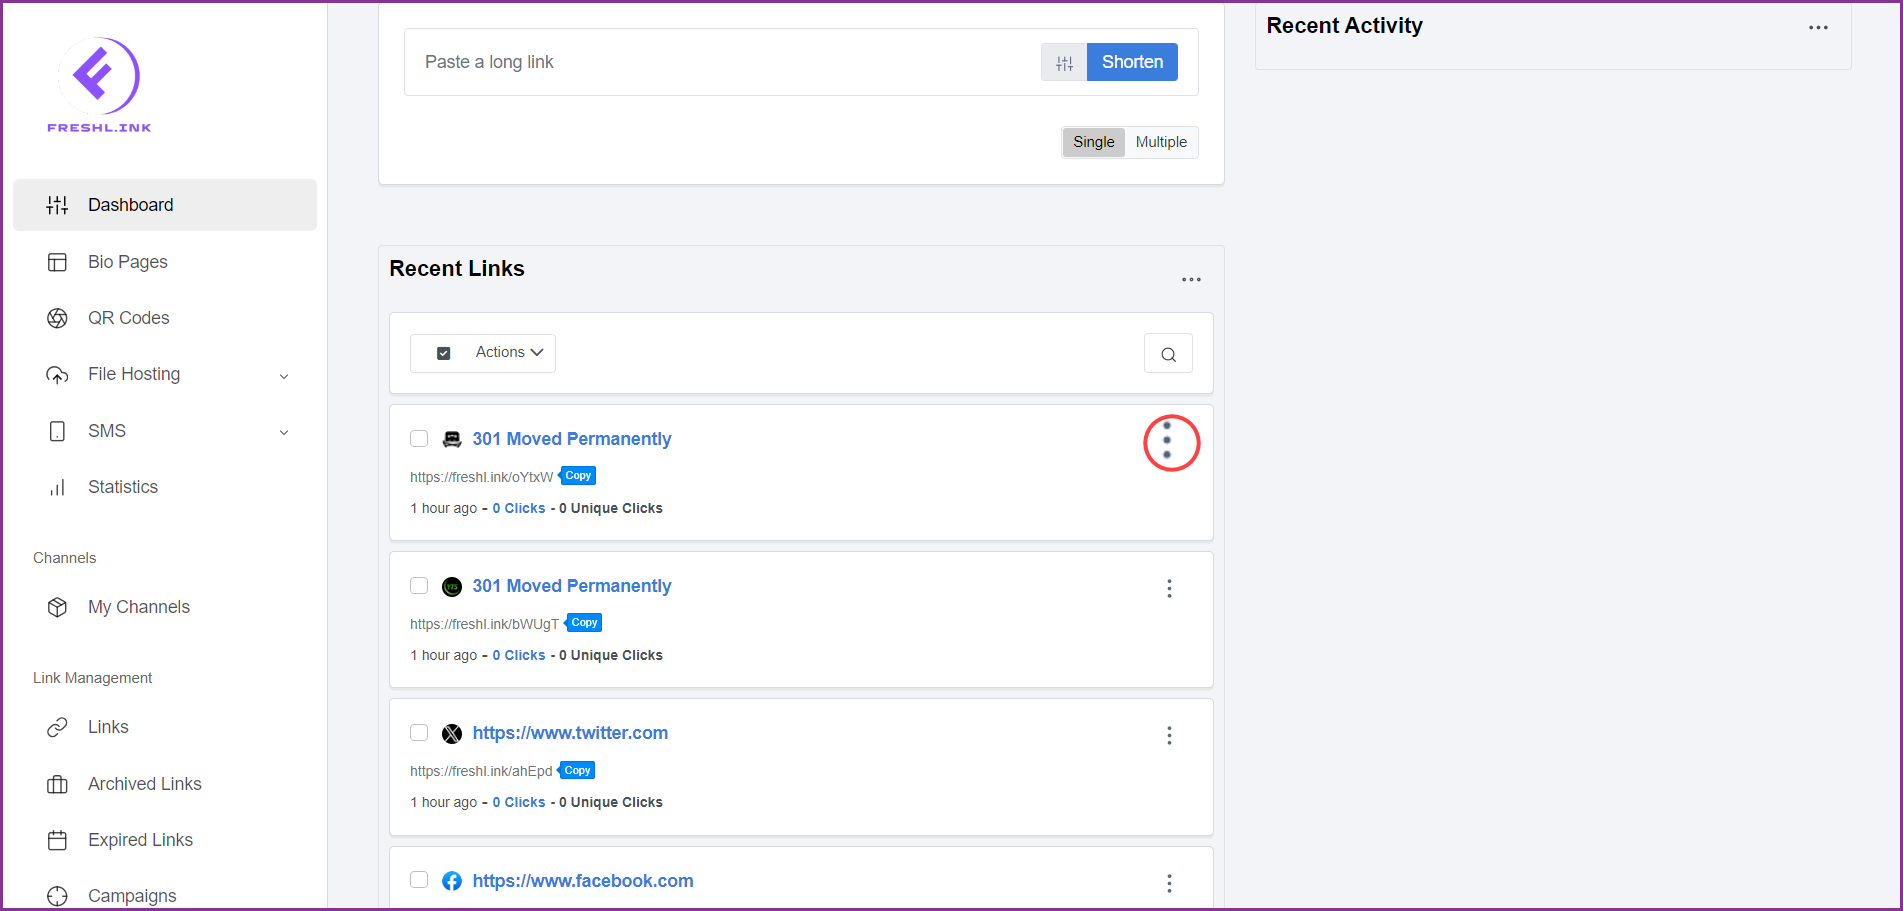
Navigate to the Recent Links section.
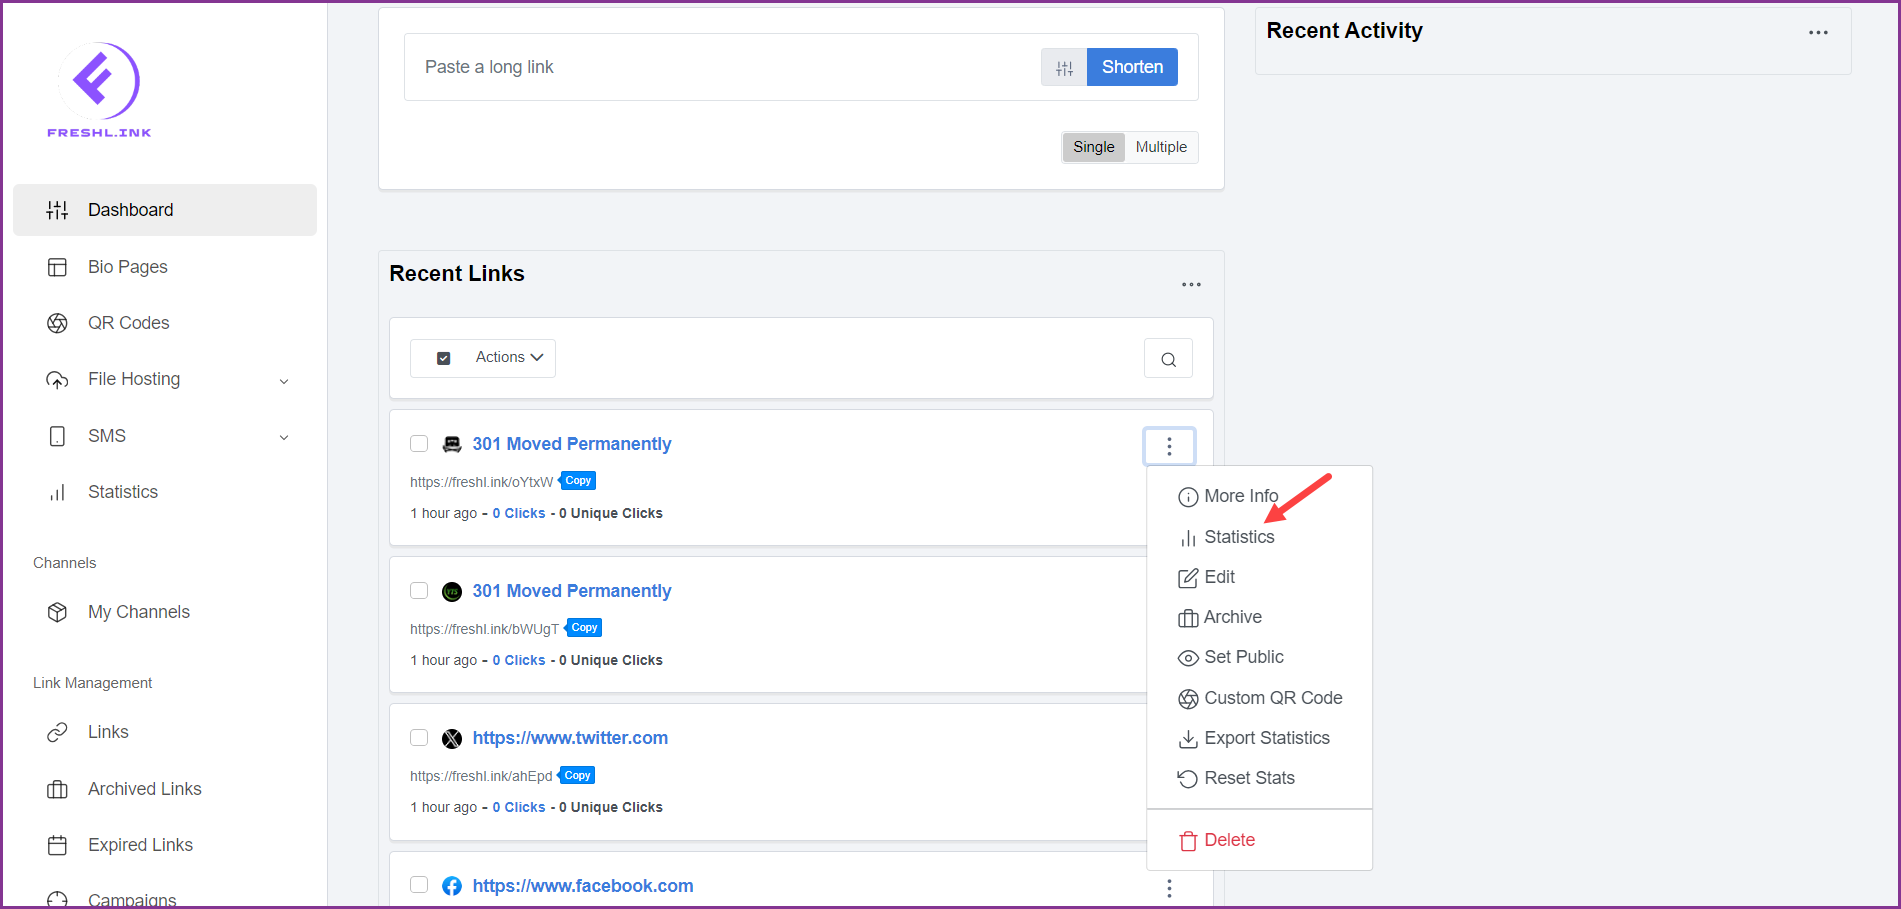
For a link you want to view statistics for, click the three-dot icon located at the top-right corner of the link card. This reveals a number of options.
Click Statistics. Doing so takes you to the Statistics page.
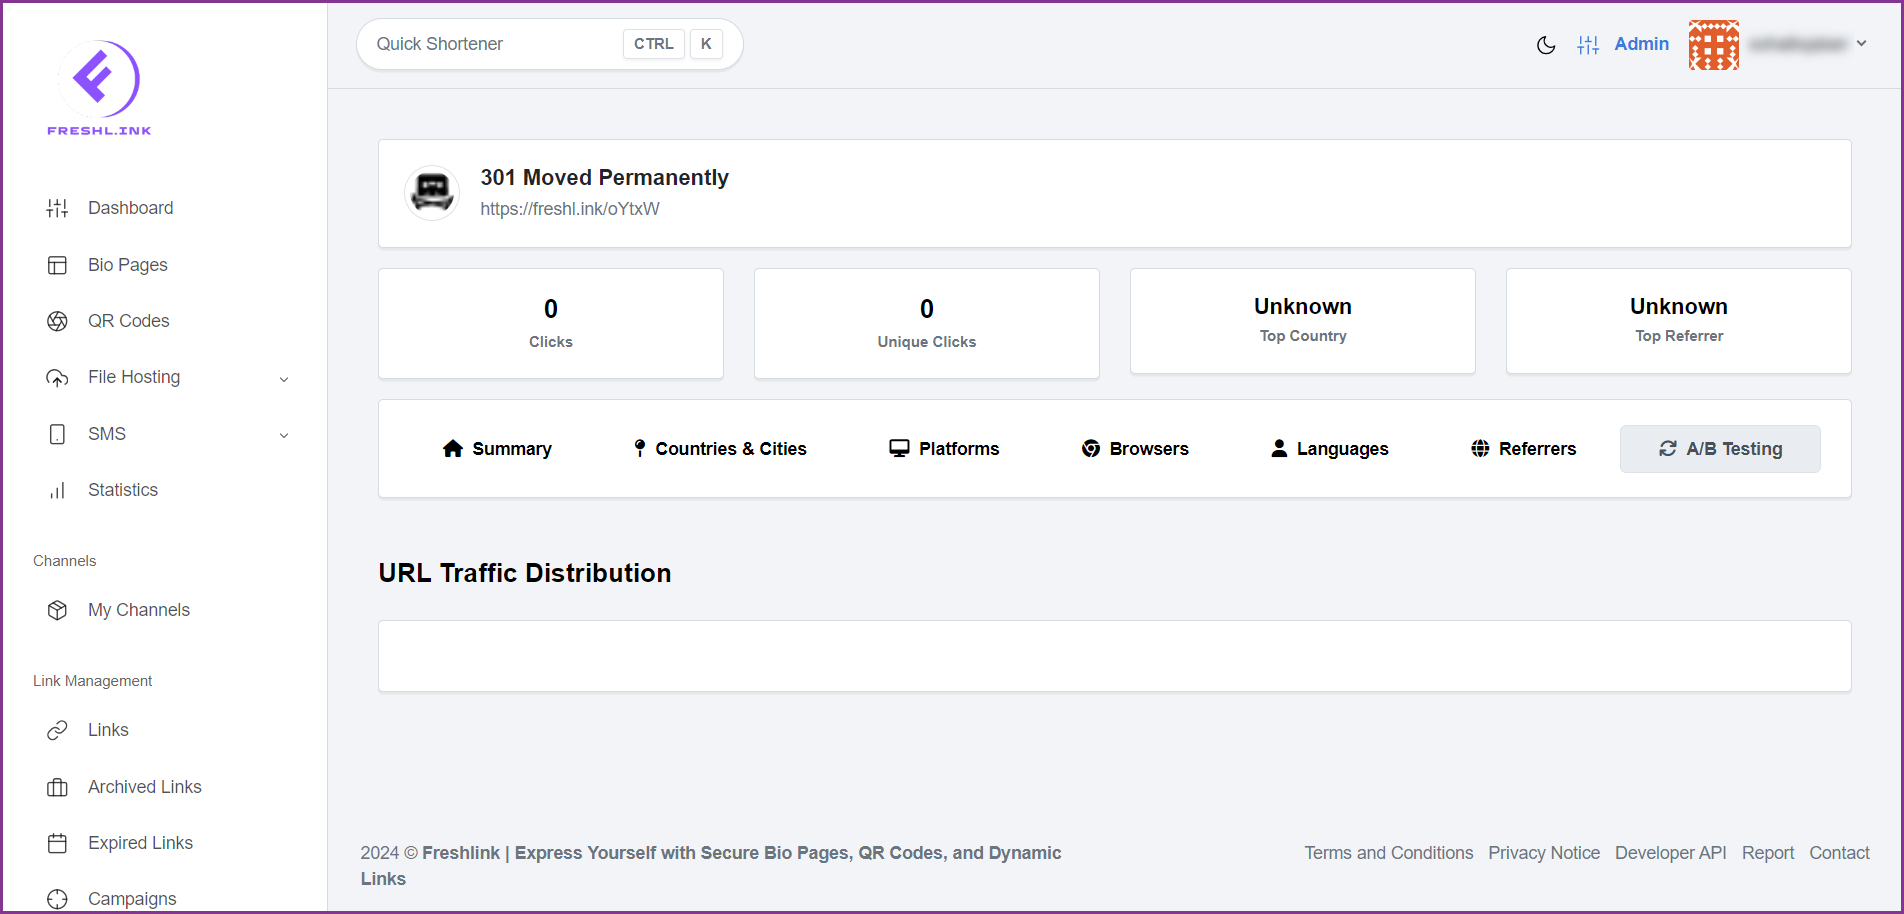
Here, a detailed view of the links for the selected link are displayed.
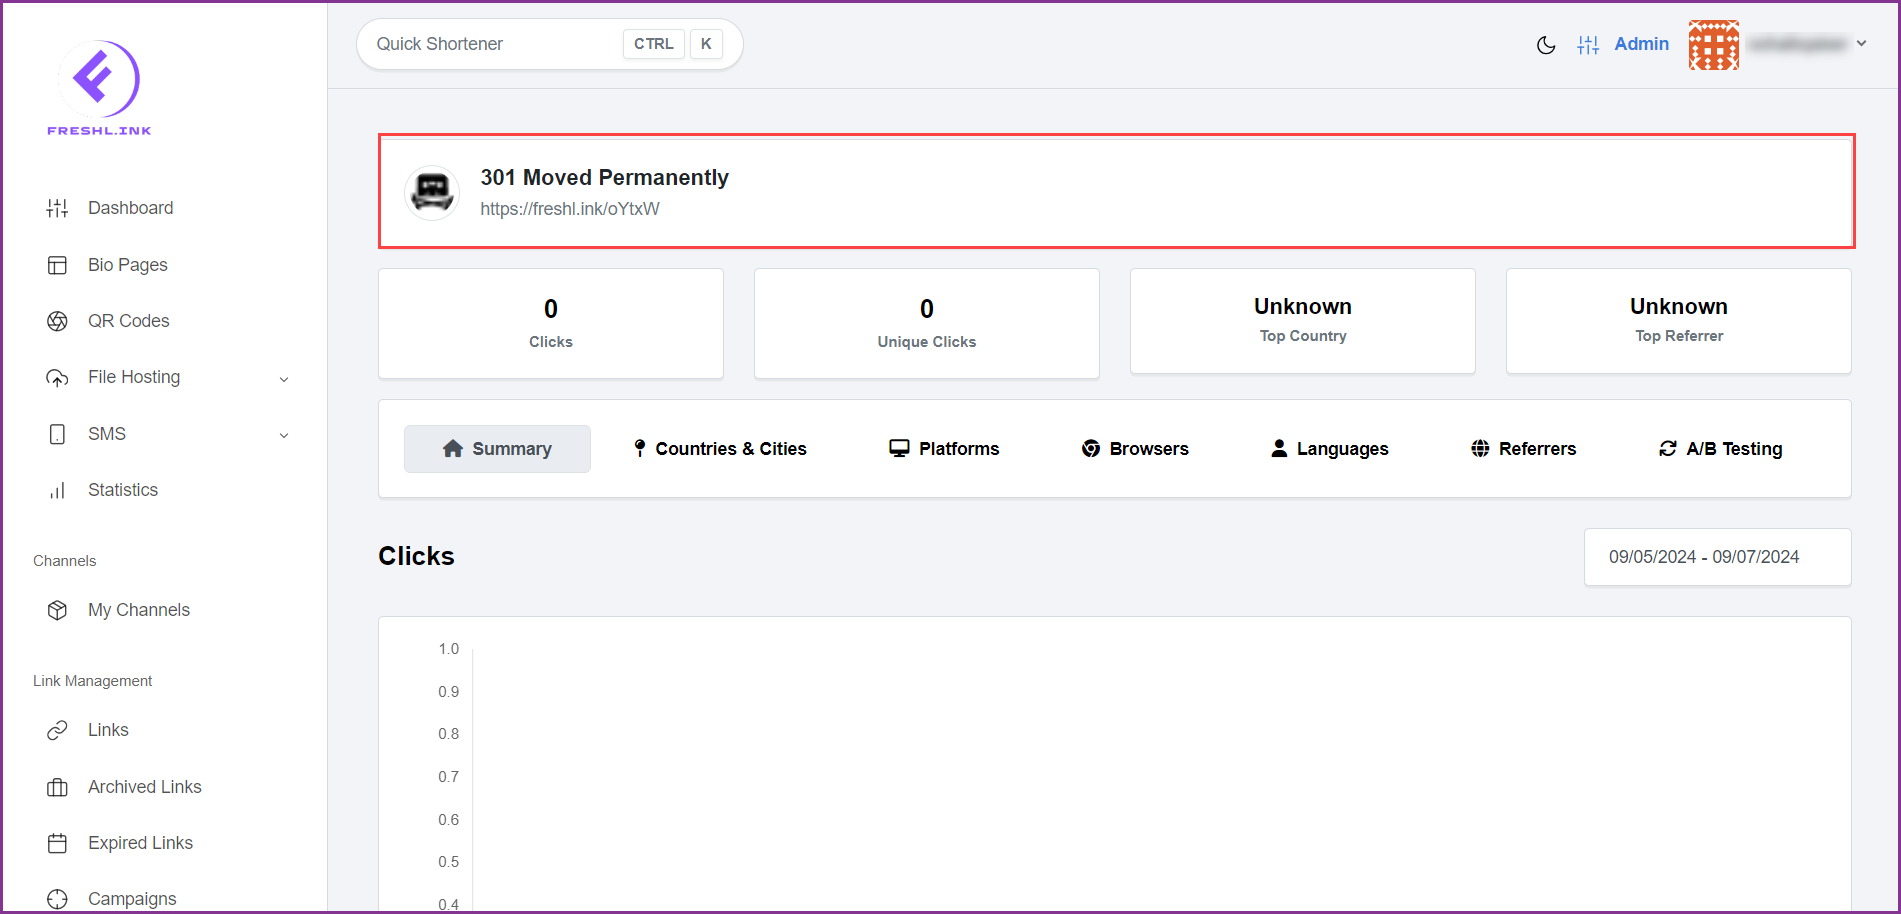
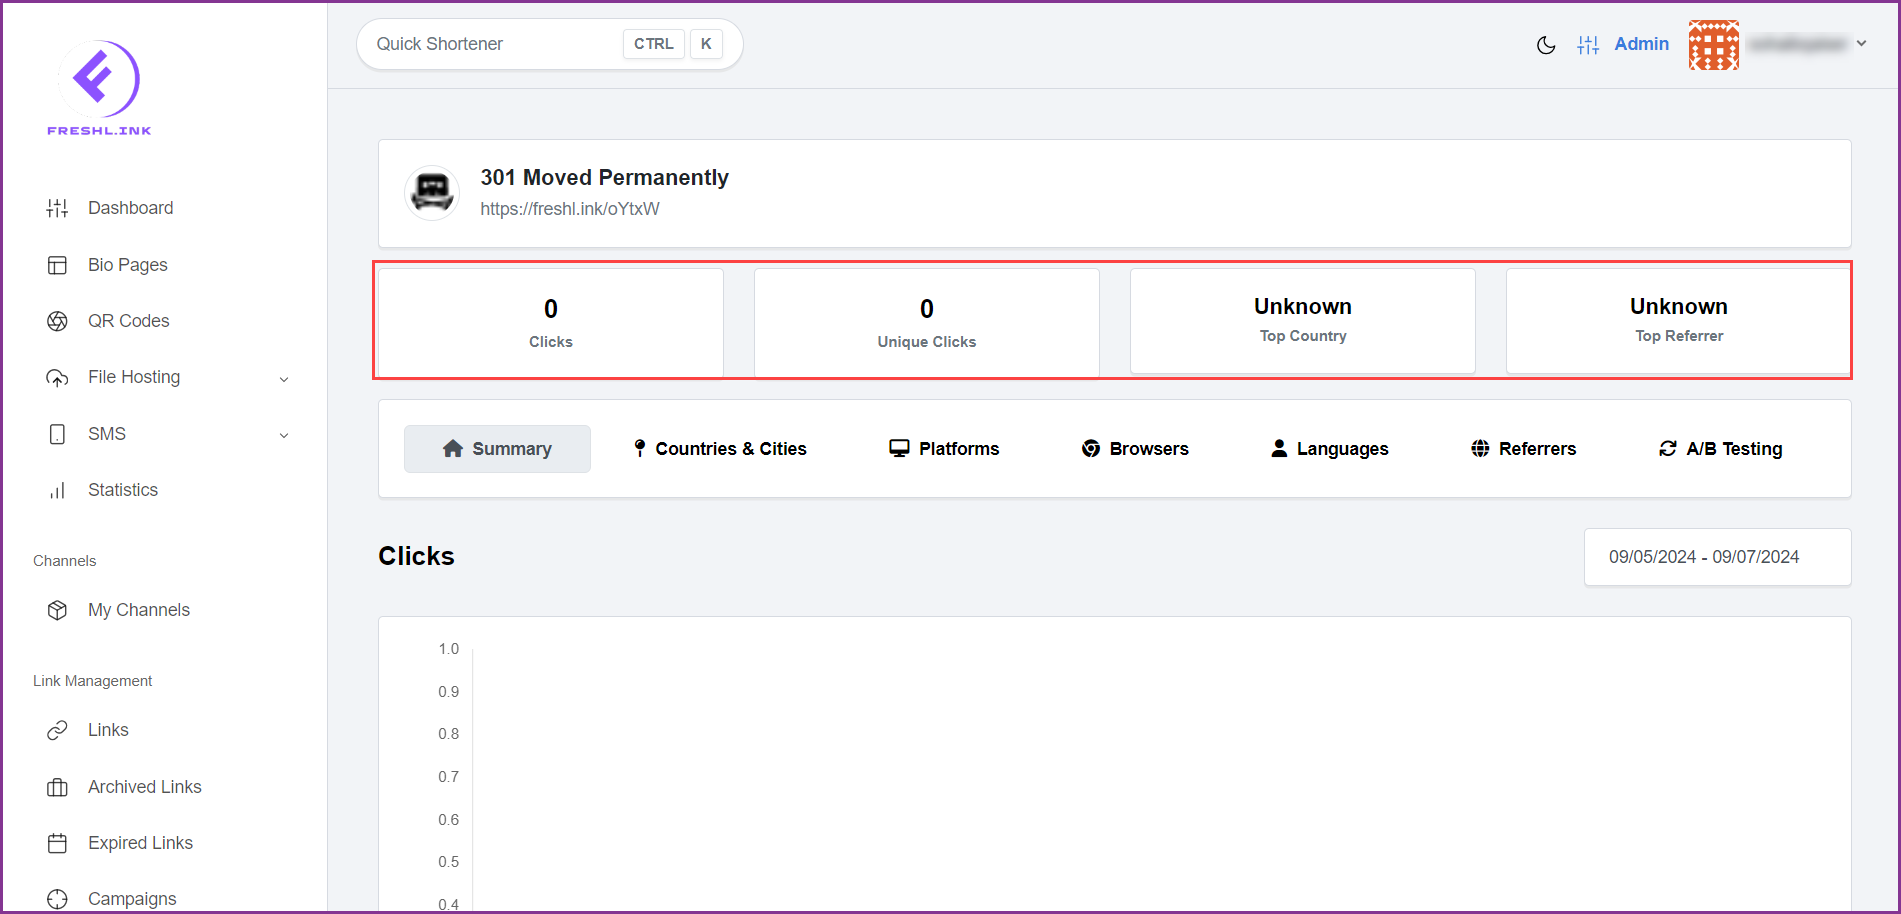
At the top is the shortened link name. Clicking this link takes you to the target URL opened in a new tab.
Moving further, 4 cards display meaningful stats relevant to the link. These include Clicks i.e. the number of clicks on the selected link, Unique Clicks i.e. the unique clicks on the selected link, Top Country i.e. the country from which maximum clicks have been made, and Top Referrer i.e. the address clicked the most in order to land on your webpage.
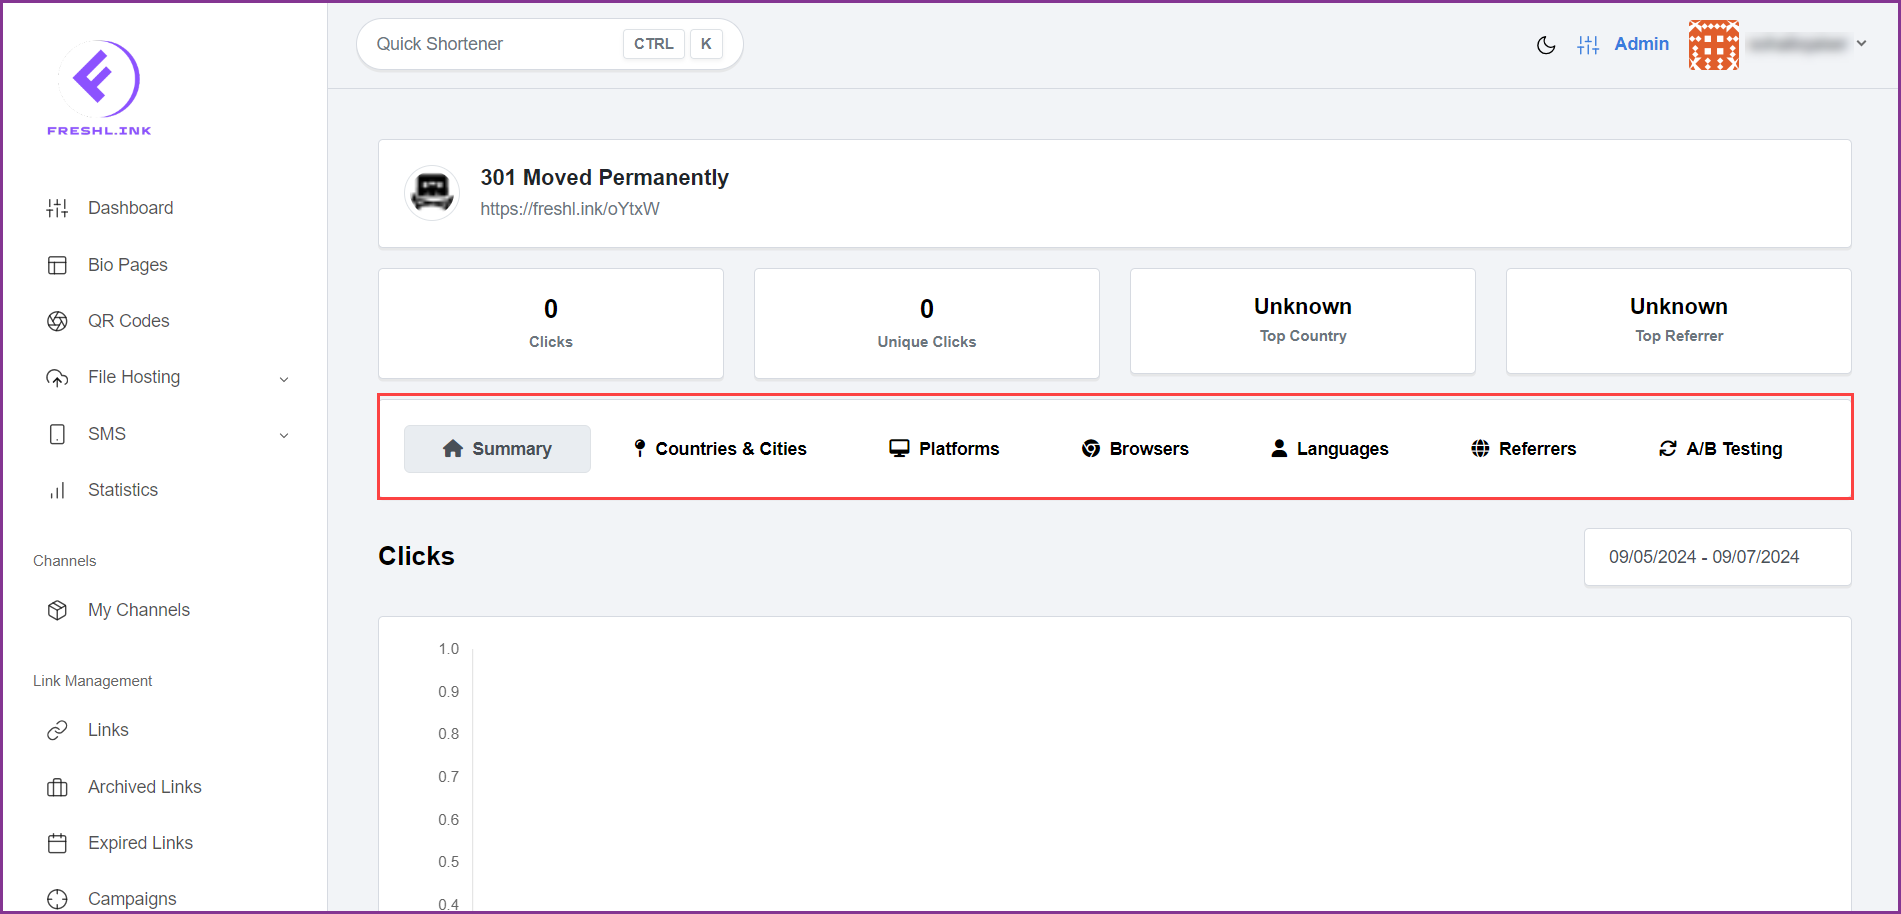
Moving further, the stats of the link are segregated into 7 tabs that include Summary, Countries & Cities, Platforms, Browsers, Languages, Referrers, and A/B Testing. By default, the Summary tab is displayed.
Summary
In the Summary tab, the Clicks graph maps the days (x-axis) against the number of clicks (y-axis). At the top-right corner is the date range you can specify in which you want to view the click trends.
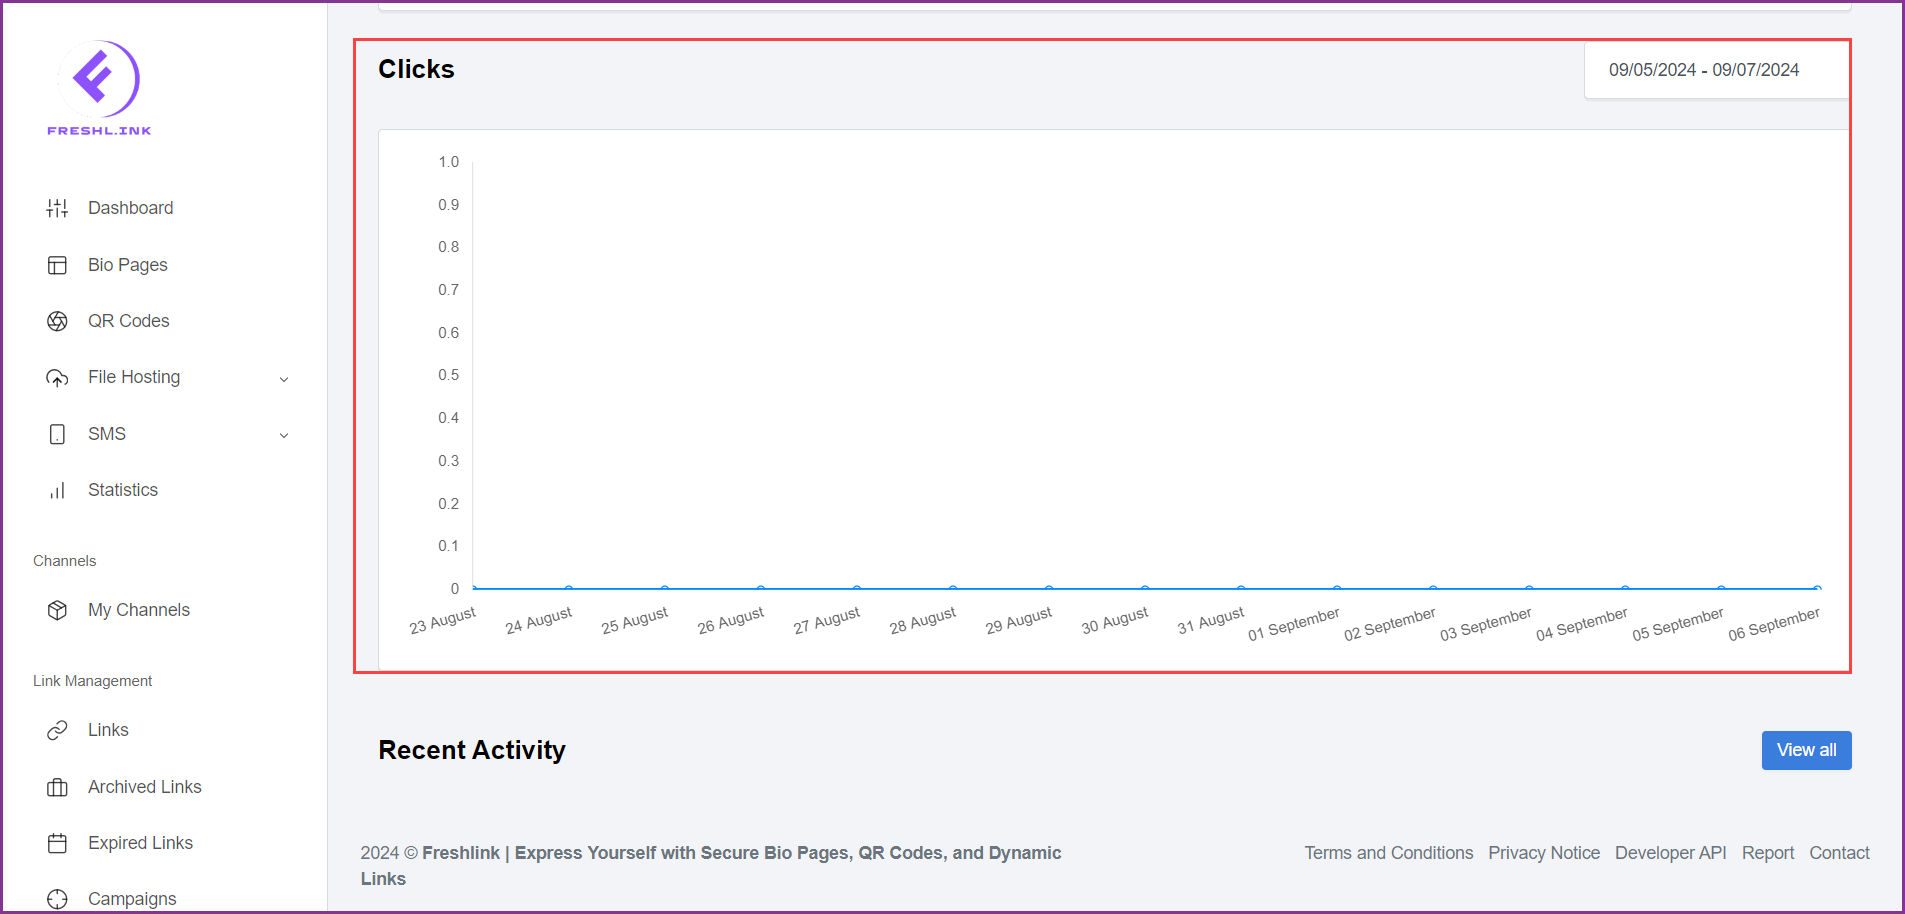
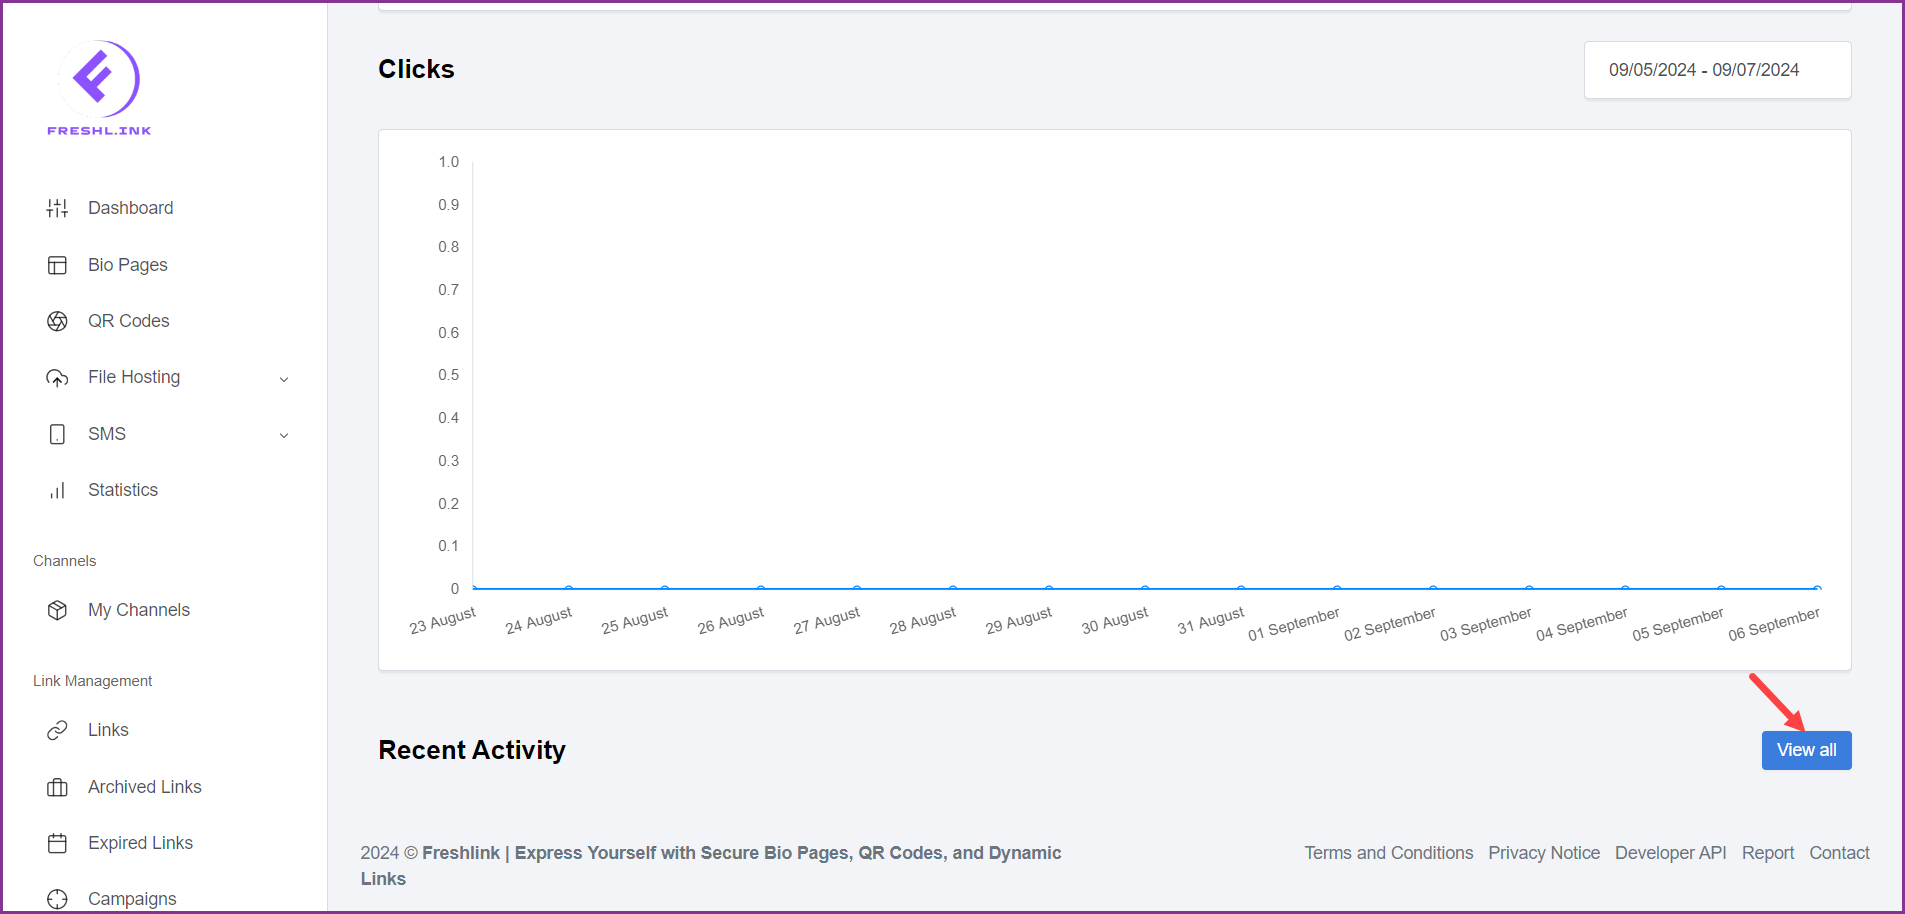
This is followed by the Recent Activity section that displays the recent activity on the selected link. To view all activity, click the  button.
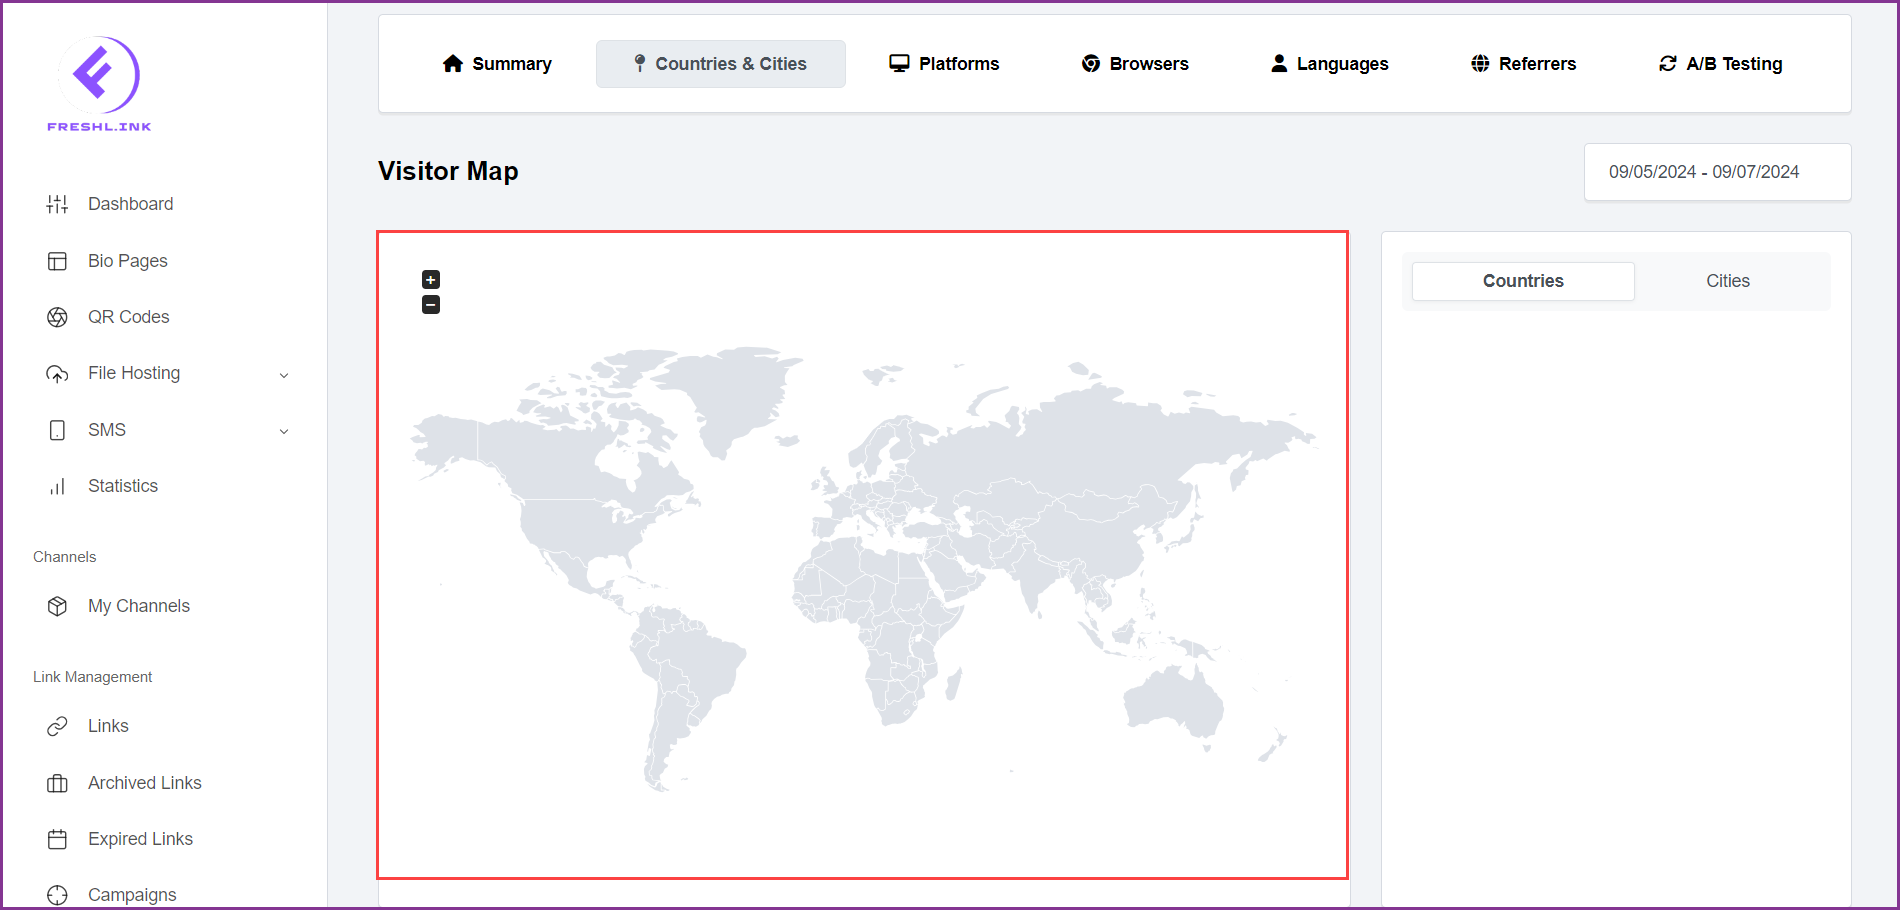
Countries & Cities
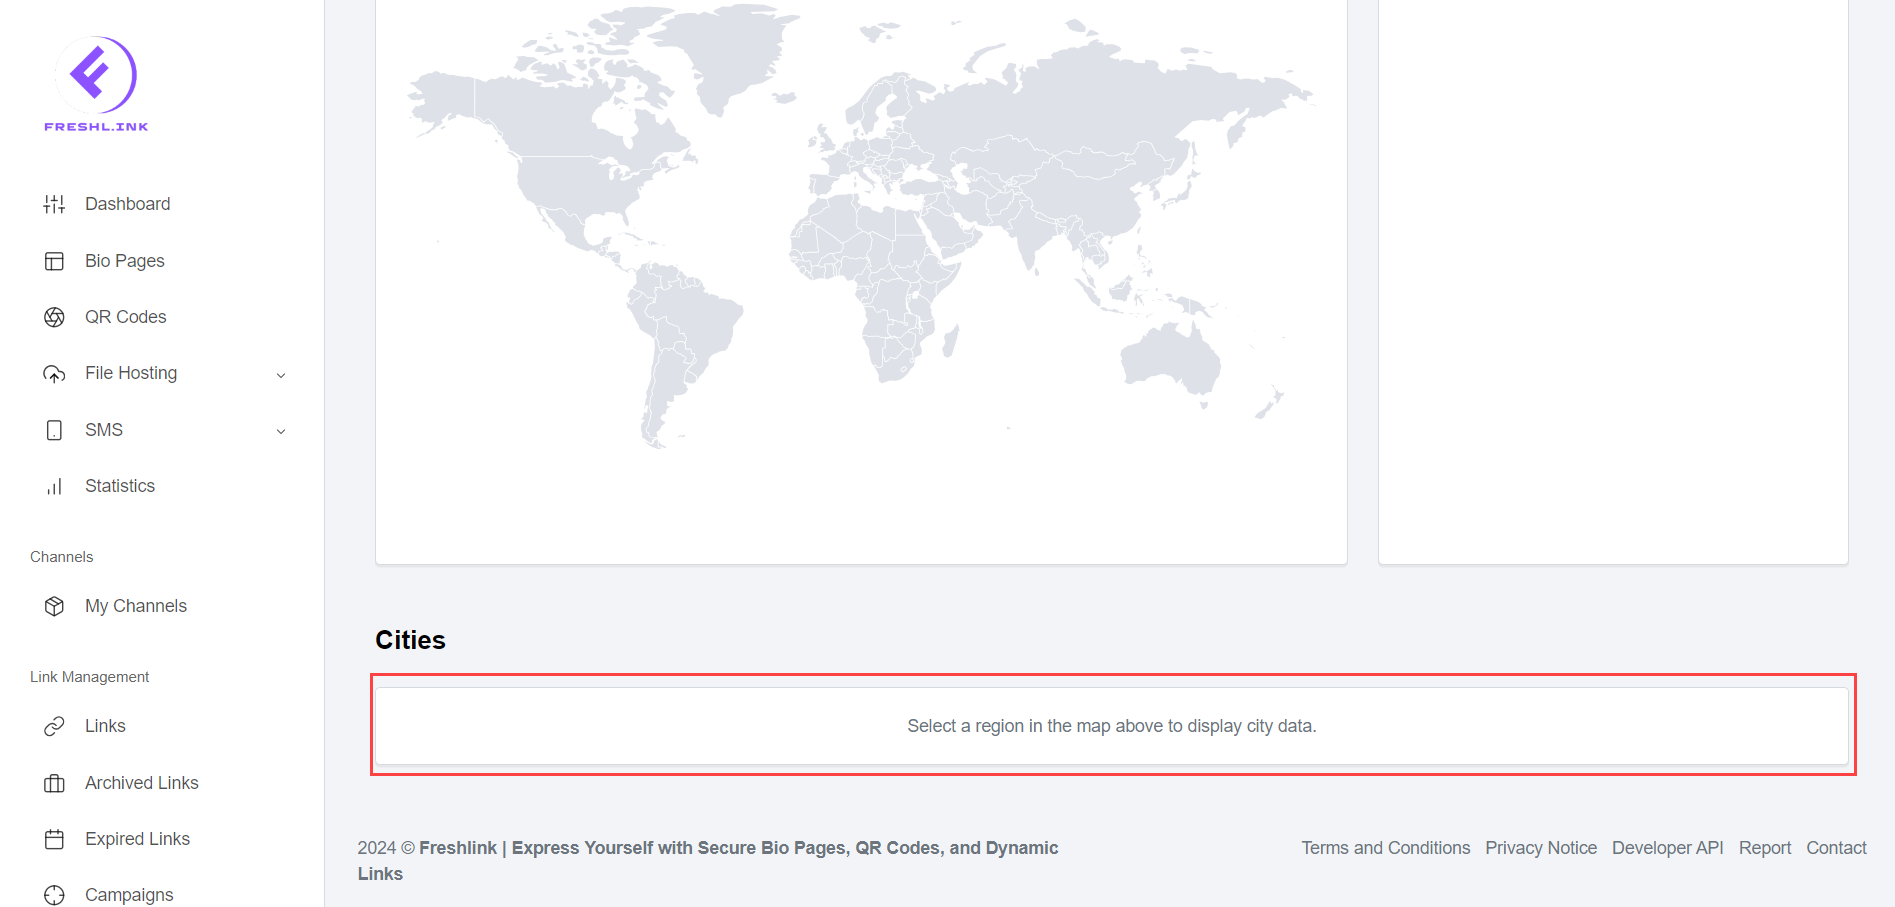
The Countries & Cities tab includes the Visitor Map which lets you select the region for which you want to view the stats pertaining to the selected link. As soon as a selection is made, the city-wise segregation for the selected country is populated in the Cities section.
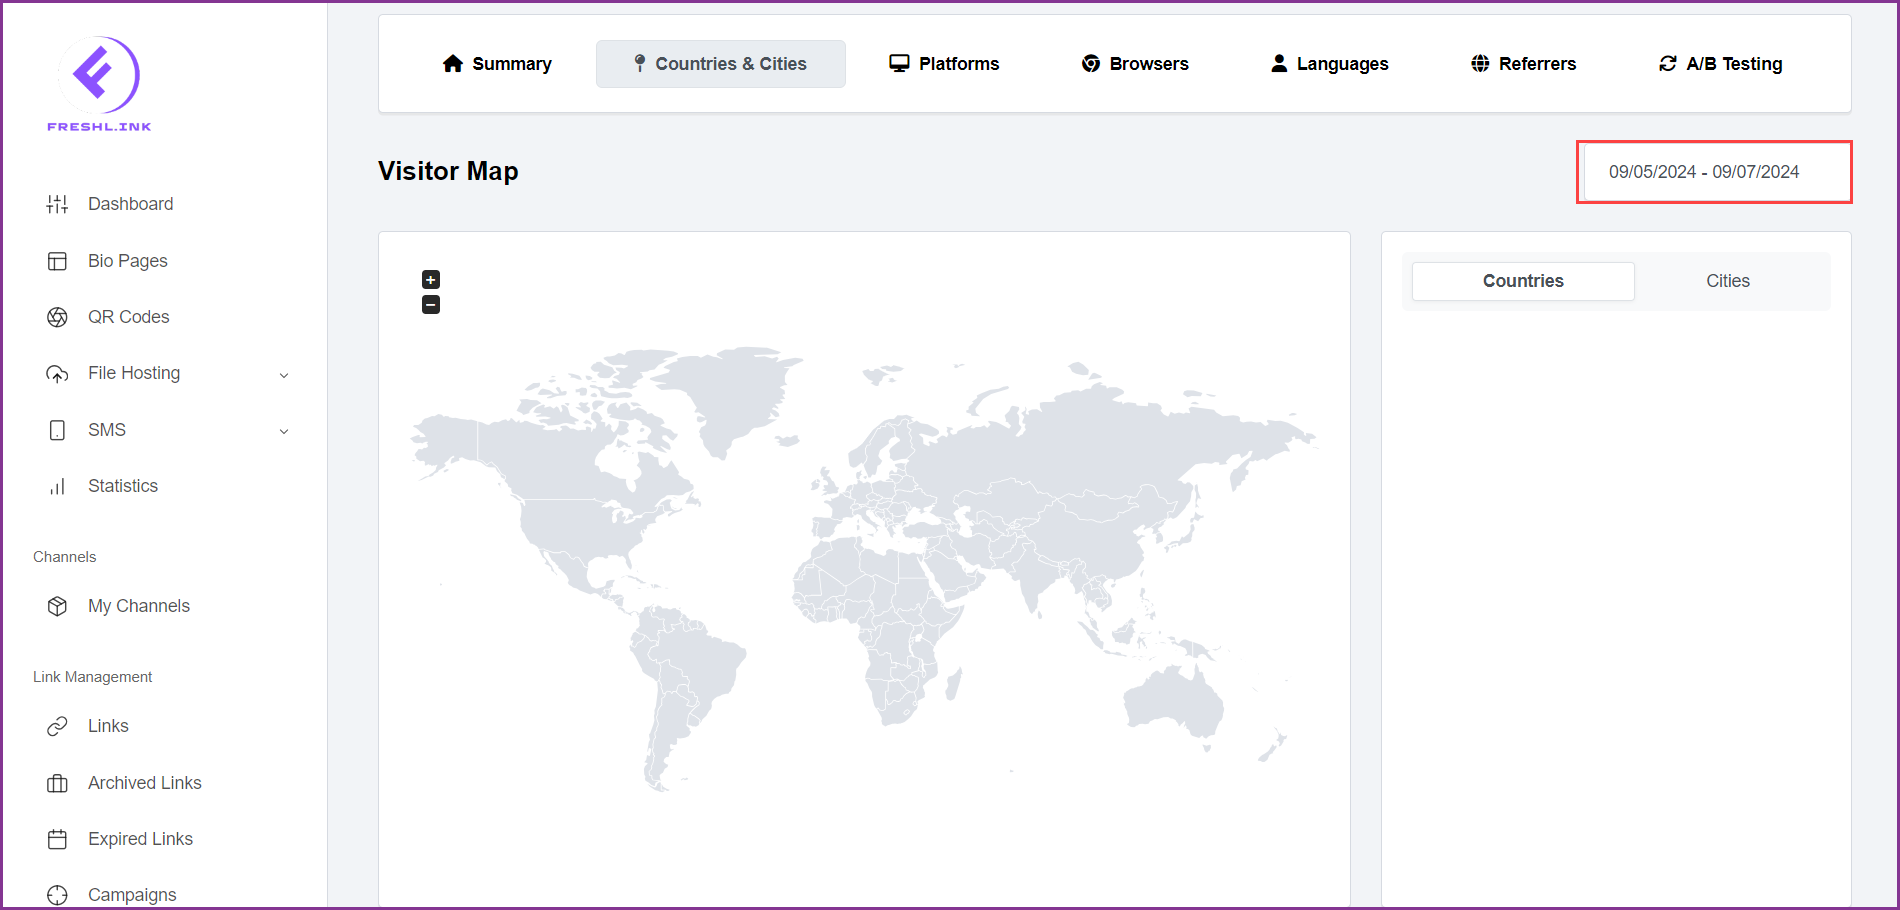
You can select the date range in a similar way as described for the Summary tab.
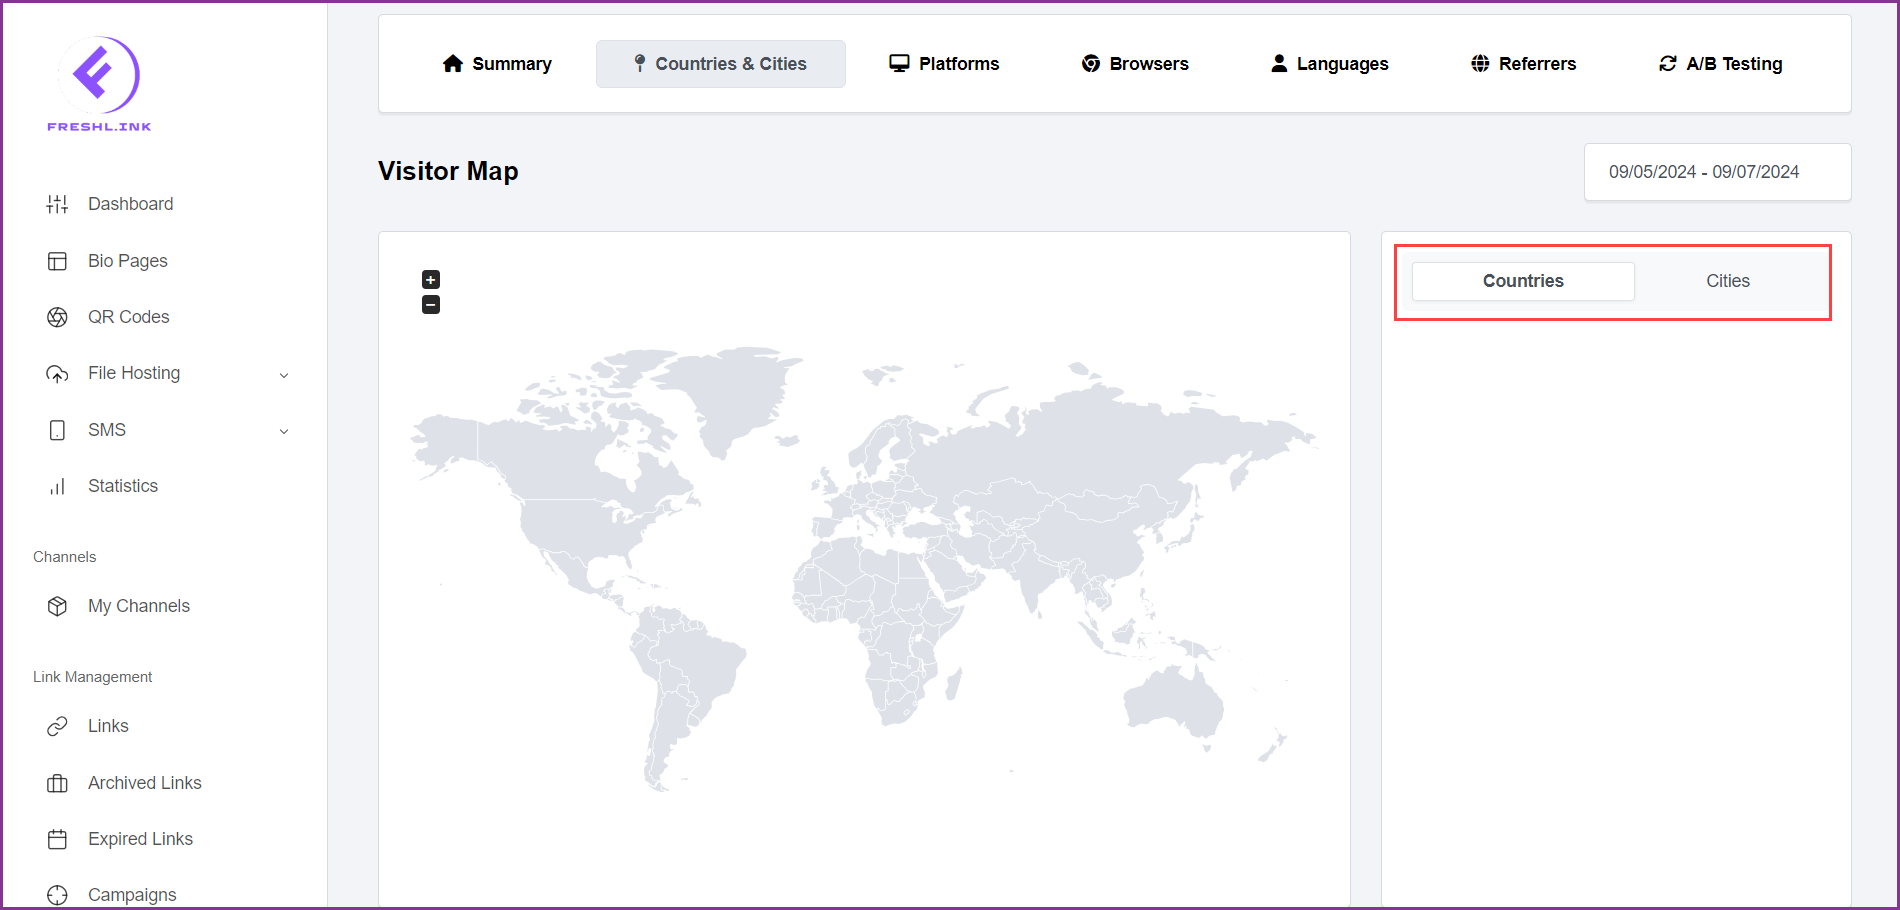
Moreover, more stats for the countries as well as cities are displayed in a section on the right side of the Visitor Map. By default, the Countries section is displayed and you can switch the cities stats by clicking the Cities toggle button.
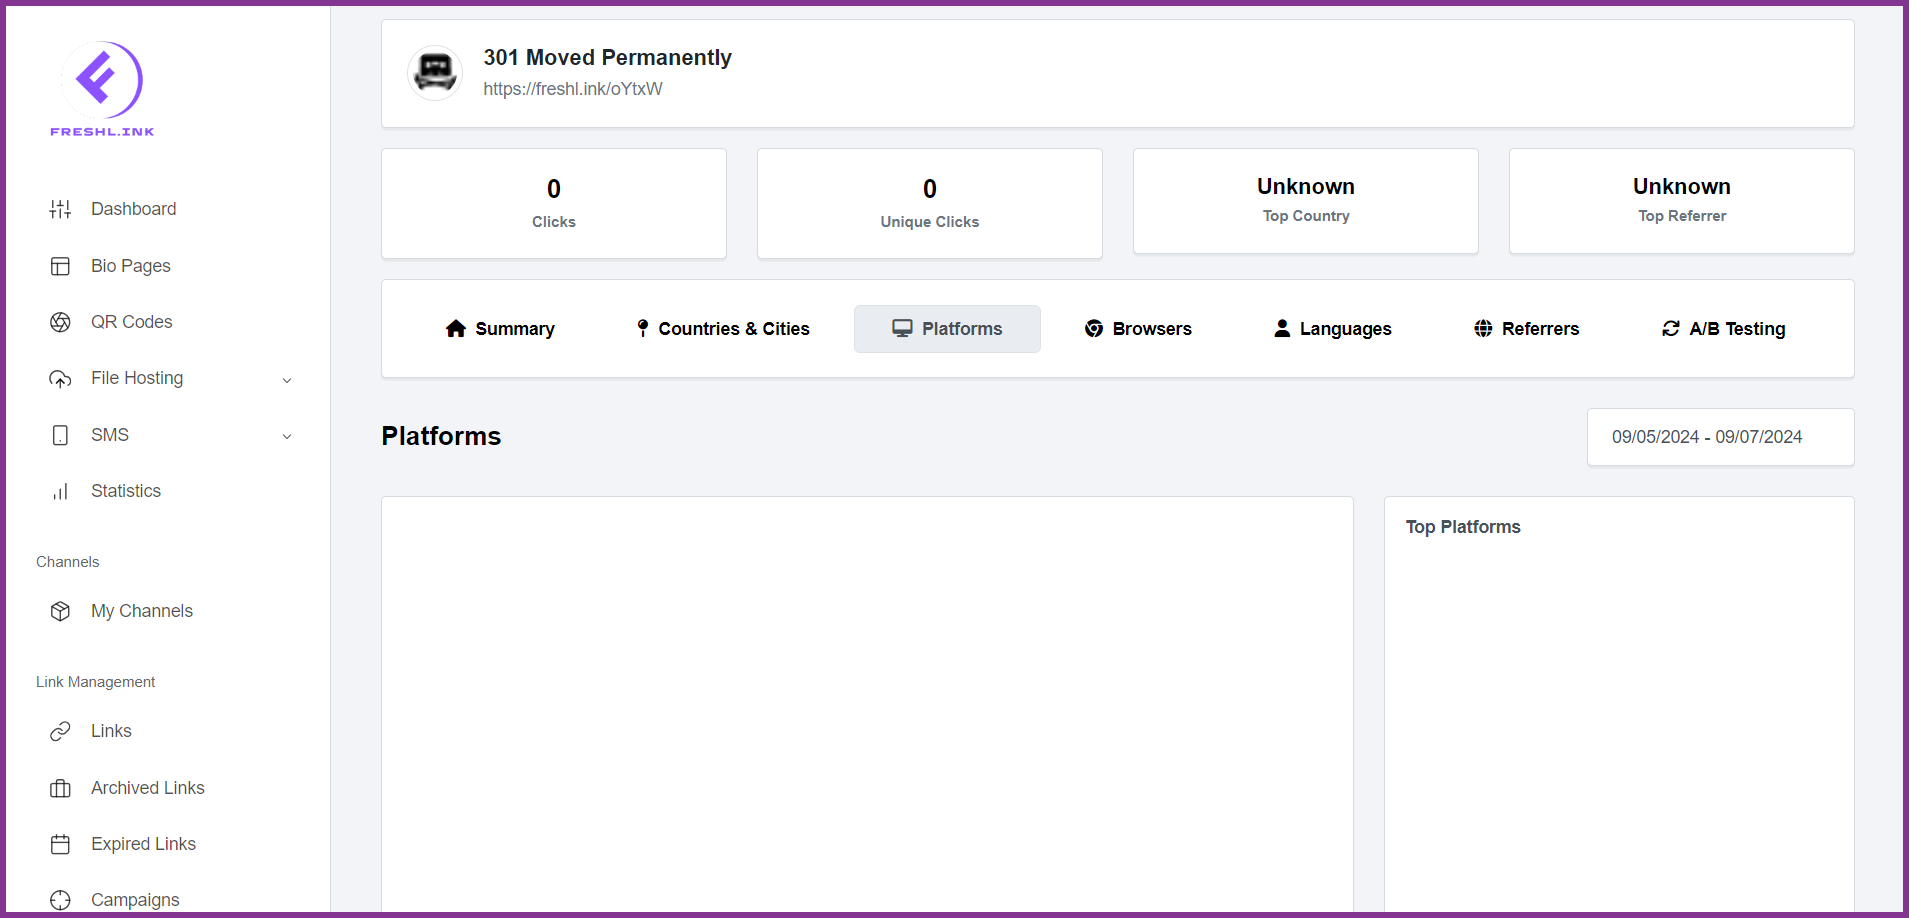
Platforms
The Platforms tab displays the stats for the selected URL w.r.t the platforms used to access it. The platforms used to access the link are listed in the Platforms section whereas the top platforms i.e. platforms via which the selected link has been accessed the most.
The date range selection is similar to the rest of the tabs.
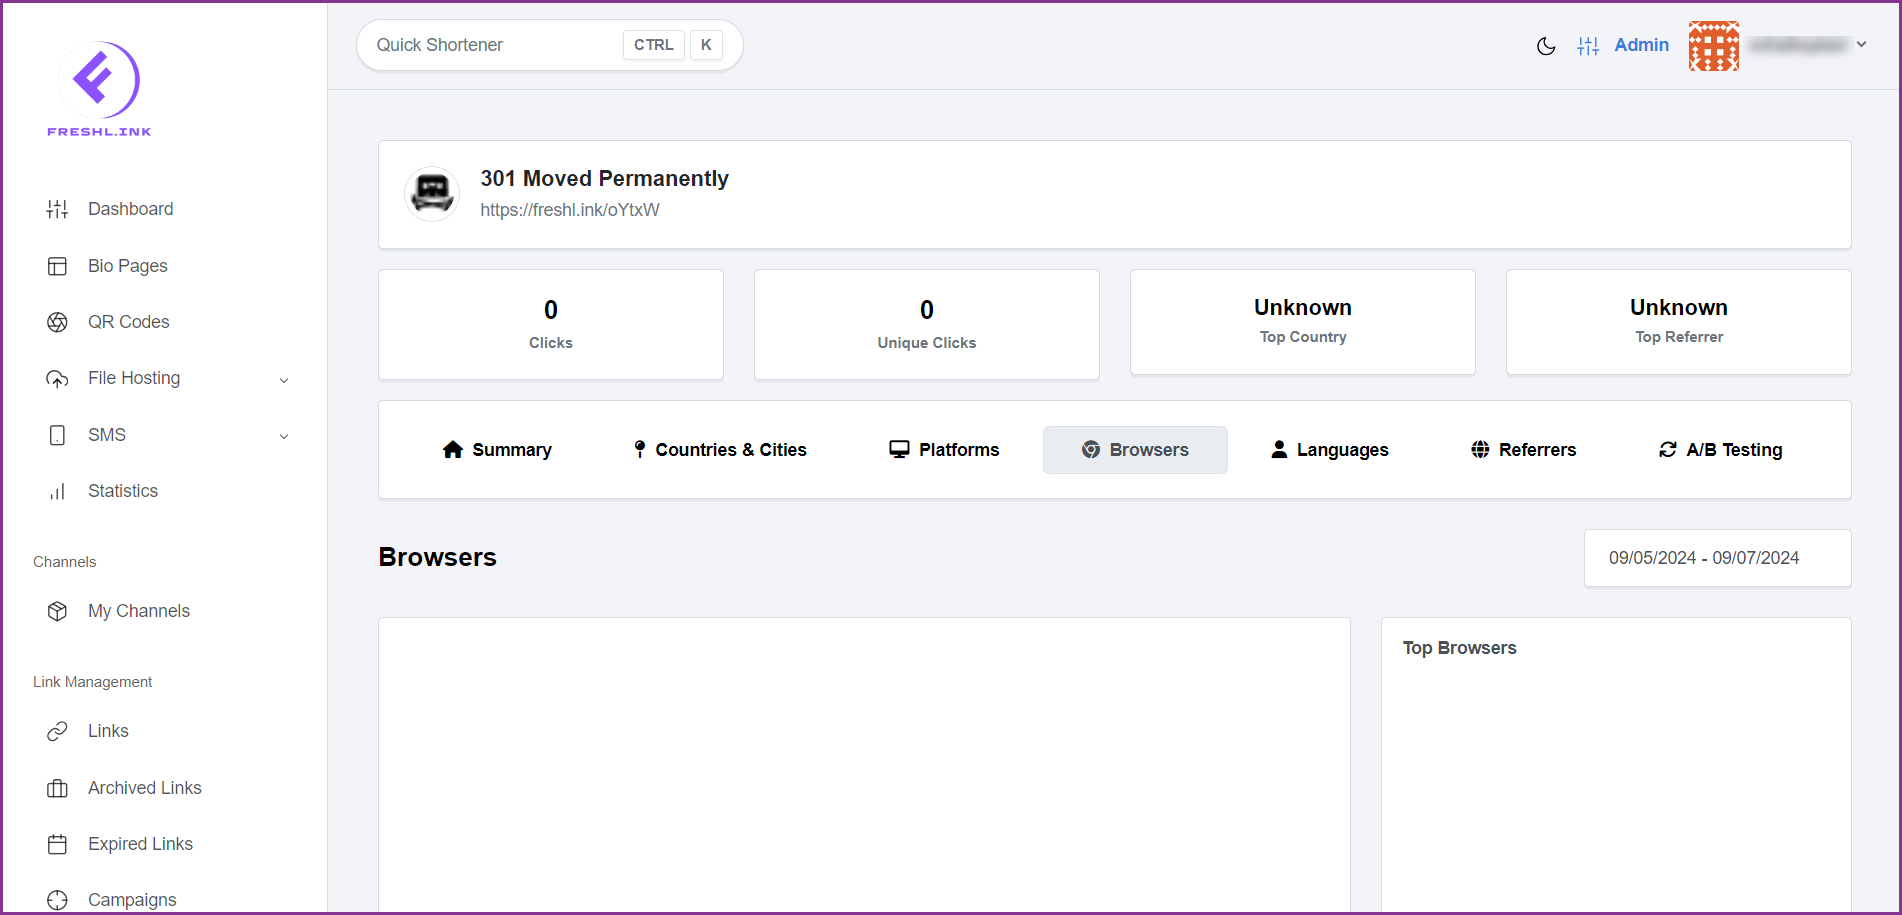
Browsers
The Browsers tab displays the stats for the selected URL w.r.t the browsers used to access it. The browsers used are listed in the Browsers section whereas the Top Browsers i.e. via which the link has been accessed the most are listed in the Top Browsers section.
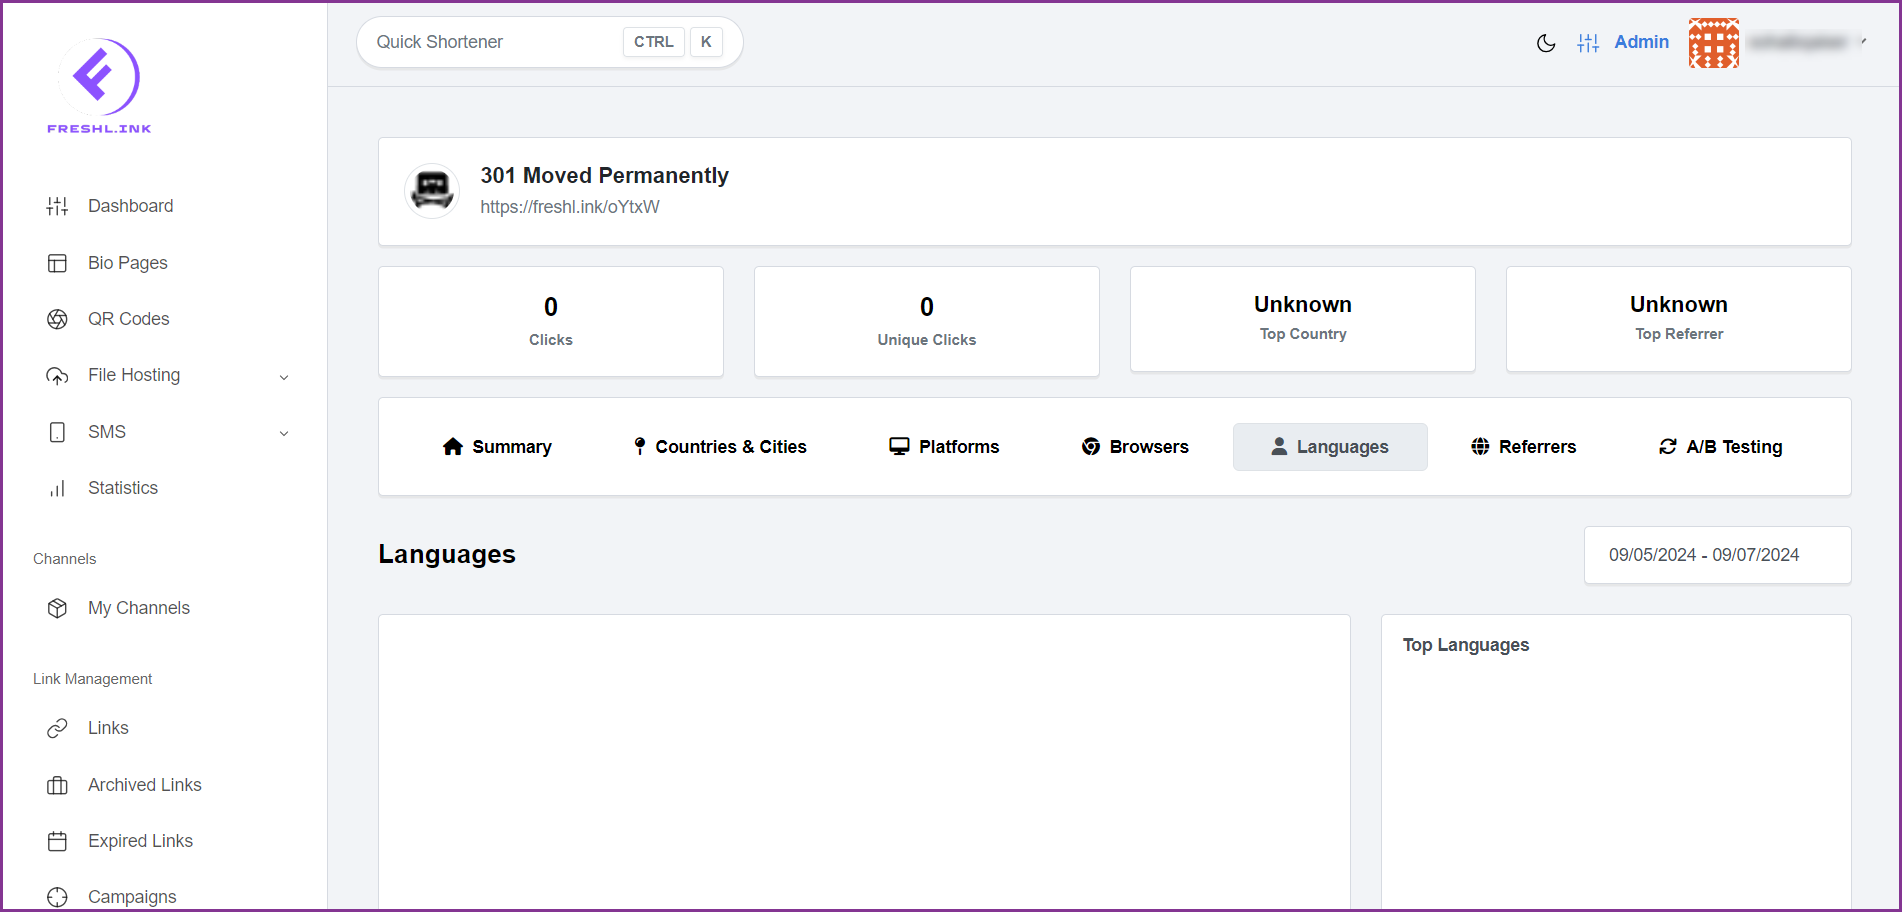
Languages
The Languages tab displays the stats for the selected URL w.r.t the language in which it has been viewed. The languages in which it is accessed are listed in the Languages section whereas the Top Languages section lists the languages in which it has been accessed the most.
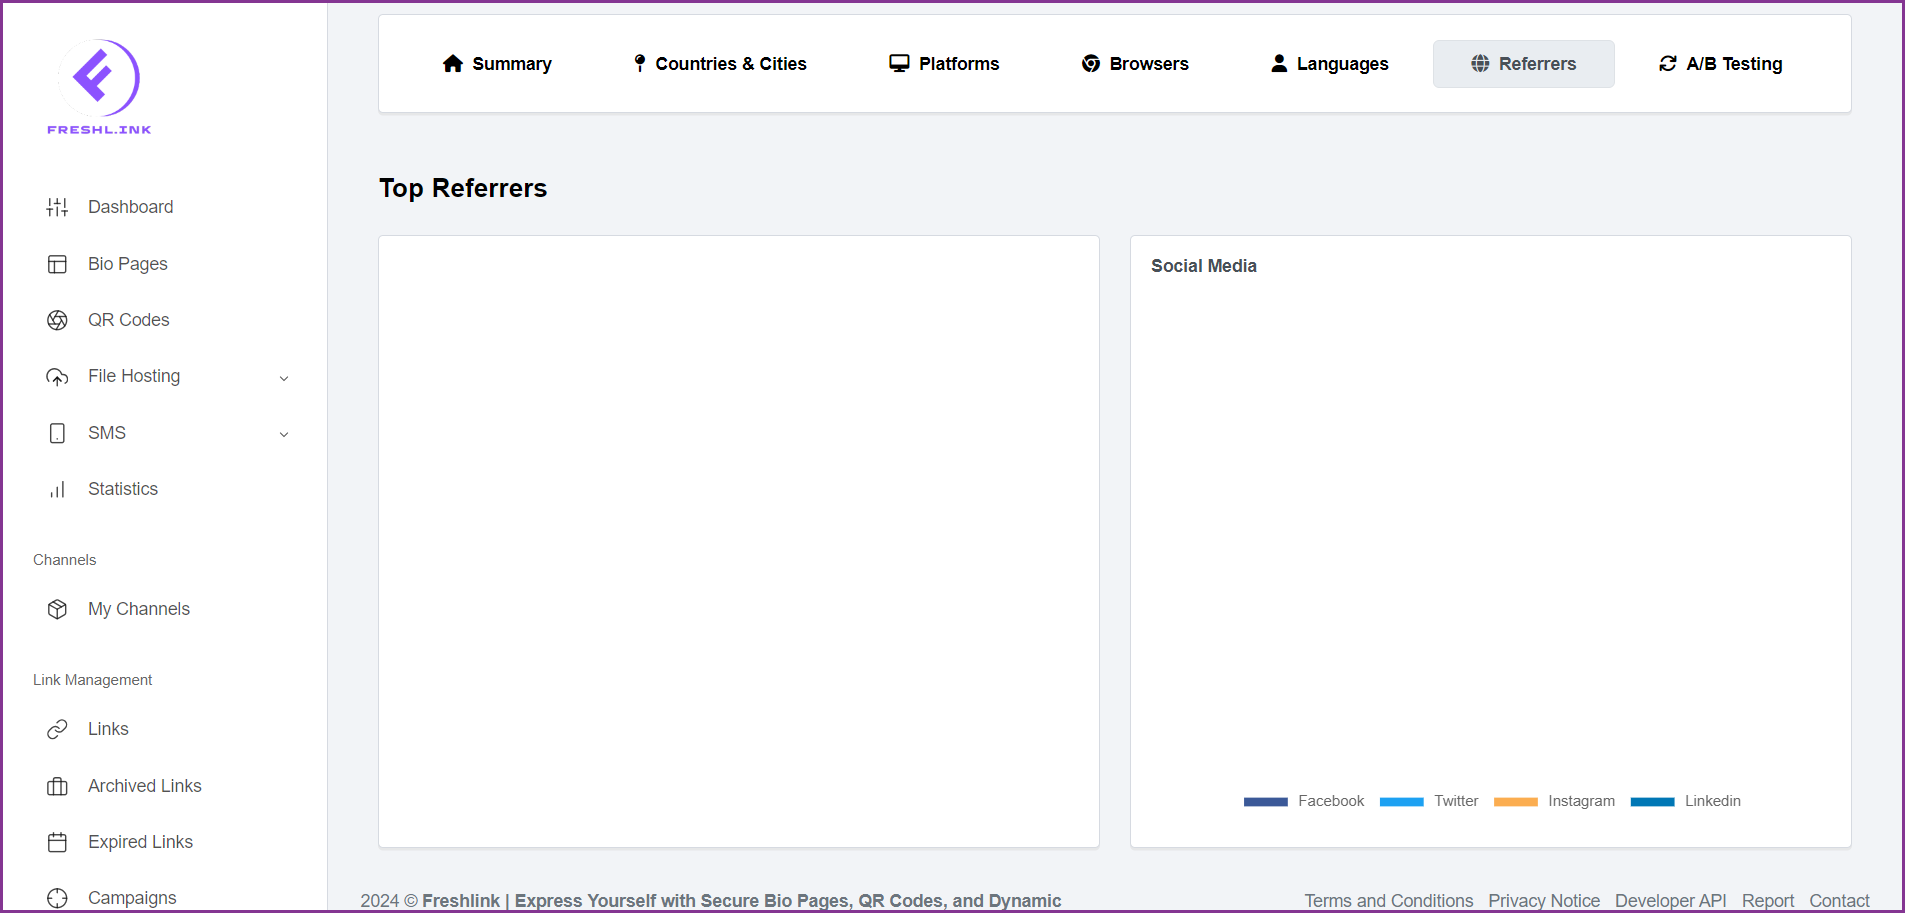
Referrers
The Referrers section displays the stats for the selected URL w.r.t the referrers i.e. the address used to land on the selected URL. Top Referrers section lists the addresses via which the most traffic landed on your webpage whereas the Social Media section displays stats for the social media platforms including Facebook, Twitter, Instagram, and LinkedIn used as referrers to land on the webpage.
A/B Testing
The A/B Testing section displays the URL traffic distribution for you to assess which version of the selected URL (long or the shortened one) performed better and brought more traffic to the page.